
Equality, diversity, and inclusion are at the heart of how we deliver our services. We serve and employ people from a wide range of backgrounds, and we are committed to creating an environment that is open, inclusive, and respectful of everyone.
We monitor and publish our equality and diversity data to support us in fulfilling our commitments. These frameworks help us to measure, monitor and improve equality and inclusion for staff by comparing the experiences and outcomes of different groups of staff.
Workforce Race Equality Standard (WRES) 2026
WRES summary
Workforce representation
11.1% of the workforce are BAME (Black, Asian and Minority Ethnic)
Recruitment disparity
A white applicant is 2.46x more likely to be appointed from shortlisting than a BAME applicant
Disciplinary action
A BAME staff member is 1.87x more likely to enter the disciplinary process
Access to training
BAME staff and white staff report similar experiences of accessing non-mandatory training and personal development (+ve position)
NHS staff survey insights
Harassment/bullying/abuse from patients/public:
- BAME: 34%
- White: 21%
Harassment/bullying/abuse from staff:
- BAME: 18%
- White: 16%
Discrimination from managers/colleagues:
- BAME: 13%
- White: 6%
Perception of fairness in career progression:
- BAME: 52%
- White: 62%
Board representation
11.1% of the Board are BAME
What we will do:
- Develop an Anti-Racism Policy and Managers’ Guide
- Deliver a Trust-wide anti-racism campaign
- Improve reporting, support and responses to racism
- Provide anti-racism training for managers and leaders
- Hold leaders accountable for progress
- Review policies and processes through an anti-racist lens
- Improve recruitment, development and career progression opportunities
- Work with staff and partners to create an anti-racist organisation
WRES graphs
Workforce ethnicity percentage of workforce who are BAME graph
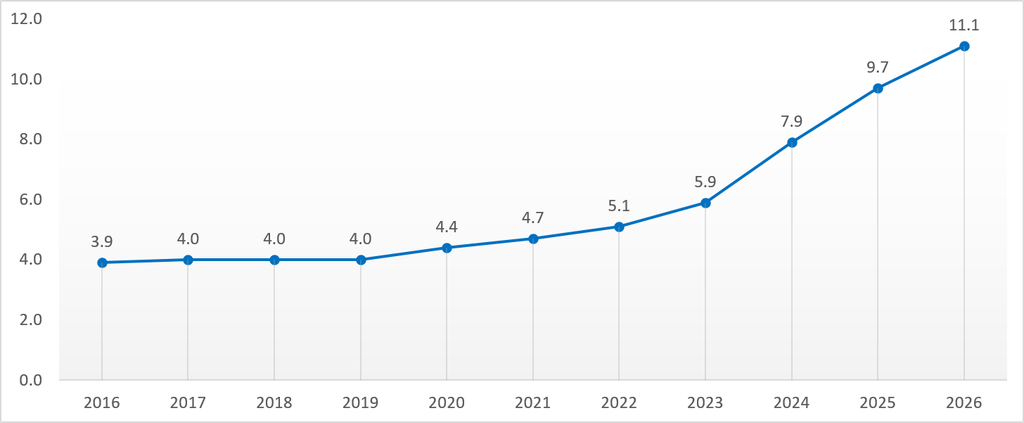
The chart shows the percentage of the workforce who are from Black, Asian and Minority Ethnic (BAME) backgrounds between 2016 and 2026.
The proportion remained relatively stable at around 4% between 2016 and 2019, before increasing each year from 2020 onwards.
Growth accelerated from 2023, rising from 5.9% to 7.9% in 2024, 9.7% in 2025 and 11.1% in 2026, the highest level shown. Overall, the proportion has increased from 3.9% in 2016 to 11.1% in 2026.
Recruitment – likelihood of a white applicant being appointed from shortlisting compared to a BAME applicant graph
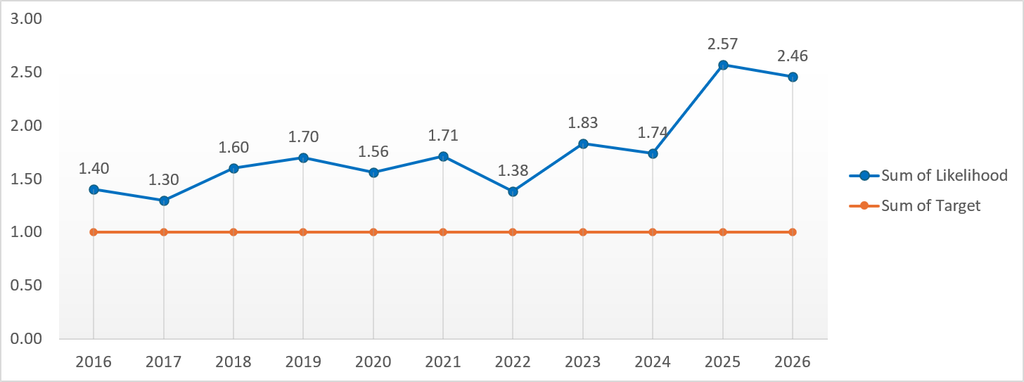
The chart shows the likelihood of a White applicant being appointed from shortlisting compared with a BAME applicant between 2016 and 2026. A value of 1.0 represents equal likelihood of appointment. White applicants were more likely to be appointed than BAME applicants in every year shown.
The likelihood fluctuated between 1.30 and 1.83 from 2016 to 2024, before rising sharply to 2.57 in 2025. It reduced slightly to 2.46 in 2026, meaning White applicants remained approximately two and a half times as likely to be appointed as BAME applicants.
Disciplinary – likelihood of BAME staff entering disciplinary processes compared to white staff graph
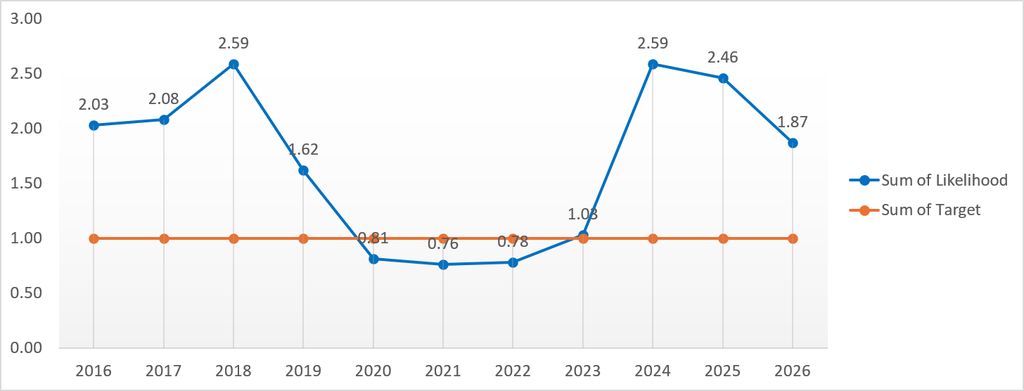
The chart shows the likelihood of BAME staff entering a formal disciplinary process compared with White staff between 2016 and 2026. A value of 1.0 represents equal likelihood. The rate fluctuates considerably over the period.
BAME staff were more than twice as likely to enter a disciplinary process in 2016 to 2018, before the likelihood reduced and fell below 1.0 between 2020 and 2022. It rose sharply to 2.59 in 2024, then reduced to 2.46 in 2025 and 1.87 in 2026.
Despite the recent reduction, the 2026 figure indicates that BAME staff remain more likely than White staff to enter a disciplinary process.
Percentage of staff experiencing harassment, bullying or abuse from patients, relatives or the public in last 12 months graph
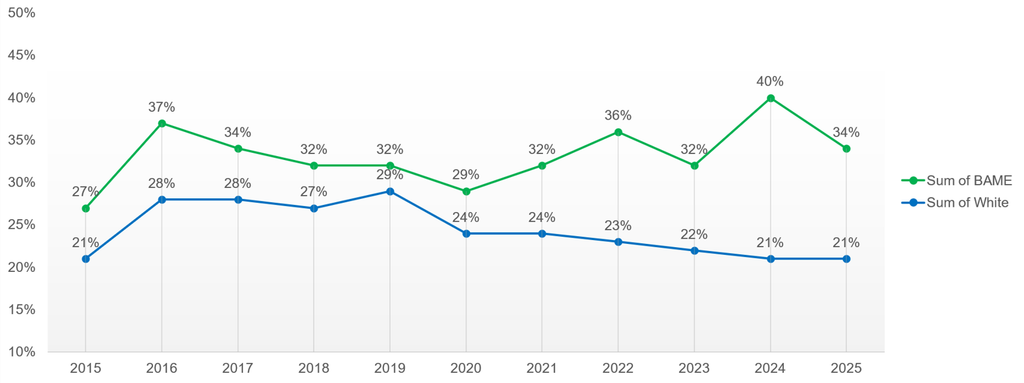
The chart shows the percentage of BAME and White staff reporting harassment, bullying or abuse from patients, relatives or the public between 2015 and 2025.
BAME staff report higher levels than White staff in every year shown.
The gap varies over time and is widest in 2024, when 40% of BAME staff reported experiencing harassment, bullying or abuse compared with 21% of White staff. In 2025, the BAME figure fell to 34%, while the White figure remained at 21%.
Percentage of staff experiencing harassment, bullying or abuse from staff in the last 12 months graph
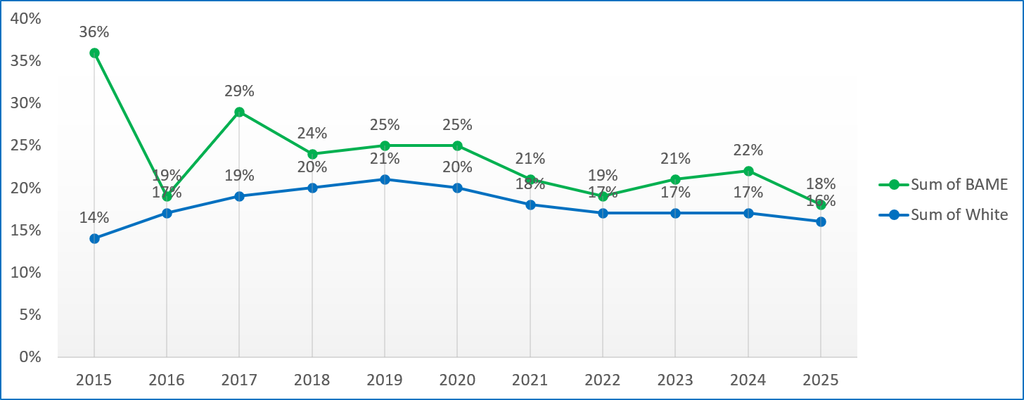
The chart shows the percentage of BAME and White staff experiencing harassment, bullying or abuse from other staff between 2015 and 2025.
BAME staff reported higher levels than White staff in most years, with the same rate of 17% in 2016 and 17% in 2022.
The gap was largest in 2015, at 36% for BAME staff compared with 14% for White staff. More recently, the gap widened from 2022 to 2024, before narrowing again in 2025. In 2025, 18% of BAME staff reported experiencing harassment, bullying or abuse from staff, compared with 16% of White staff.
Percentage of staff that believe the Trust acts fairly with regards to career progression and promotion graph
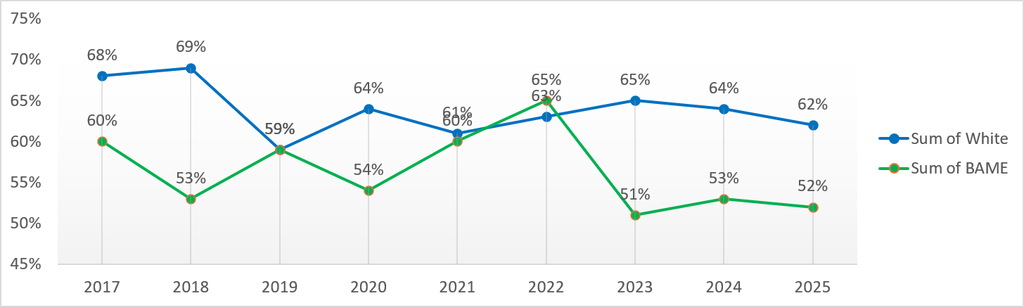
The chart shows the percentage of BAME and White staff who believe the Trust acts fairly with regard to career progression and promotion between 2017 and 2025.
White staff reported more positive perceptions than BAME staff in most years. The largest gap was in 2018, when 69% of White staff believed the Trust acted fairly compared with 53% of BAME staff.
The figures were equal at 59% in 2019, while in 2022 BAME staff reported a slightly higher figure, 65%, compared with 63% of White staff. Since then, the position has reversed, with a sizeable gap remaining in 2025: 62% of White staff compared with 52% of BAME staff.
Percentage that have personally experienced discrimination at work from manager/team leader or other colleagues in the last 12 months graph
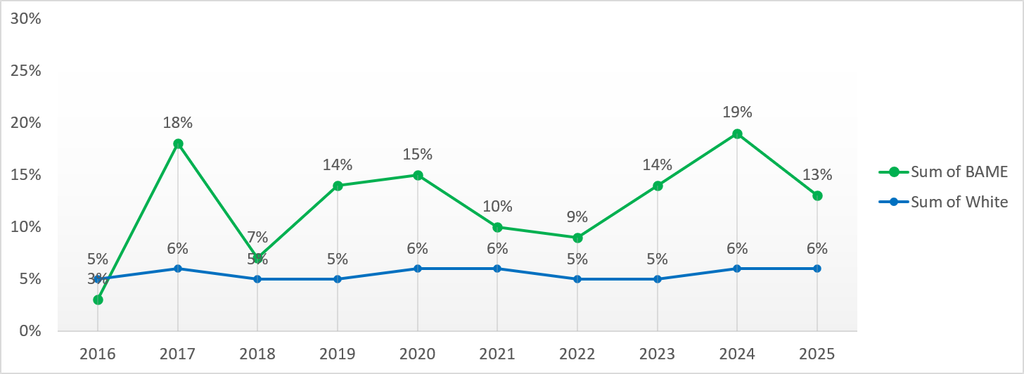
The chart shows the percentage of BAME and White staff who reported personally experiencing discrimination at work from a manager, team leader or other colleague between 2016 and 2025.
BAME staff reported higher levels of discrimination than White staff in every year except 2016. The difference fluctuates considerably over time. In 2024, 19% of BAME staff reported discrimination compared with 6% of White staff.
In 2025, the BAME figure fell to 13%, while the White figure remained at 6%, meaning a notable gap remains.
Workforce Disability Equality Standard (WDES) 2026
WDES summary
Workforce representation
- 12.8% of the workforce identify as having a disability
- 90% of staff have declared their disability status
Recruitment
Applicants without a disability are 1.19x more likely to be appointed from shortlisting than those with a disability
Capability process
Staff with a disability are less likely to enter the formal capability process than those without a disability (+ve position)
NHS staff survey insights
Harassment/bullying/abuse from patients/public:
- With long-term health condition (LTHC): 25%
- Without LTHC: 20%
Harassment/bullying/abuse from managers:
- With LTHC: 9%
- Without LTHC: 5%
Discrimination from colleagues:
- With LTHC: 18%
- Without LTHC: 10%
Perception of fairness in career progression:
- With LTHC: 54%
- Without LTHC: 65%
Pressure to work while unwell:
- With LTHC: 19%
- Without LTHC: 13%
Feeling valued by the organisation:
- With LTHC: 43%
- Without LTHC: 52%
Workplace adjustments in place:
78% of staff who require them have adjustments in place
Engagement score:
- With LTHC: 6.5
- Without LTHC: 7.1
Board Representation
16.67% of the Board identify as having a long-term health condition
What we will do:
- Develop disability inclusion guidance and support for managers and leaders
- Deliver disability inclusion training for managers and leaders
- Improve reporting, support and responses to disability-related discrimination and harassment
- Promote and strengthen the Long-Term Health Condition & Disability and Neurodiversity Staff Networks
- Increase understanding of the experiences of disabled staff and those with long-term health conditions
- Improve access to leadership, development and career opportunities
- Increase disability declaration rates and improve workforce data quality
- Develop resources and awareness campaigns to promote disability inclusion and address ableism, bullying, harassment and microaggressions in the workplace
WDES graphs
Workforce disability status declaration graph
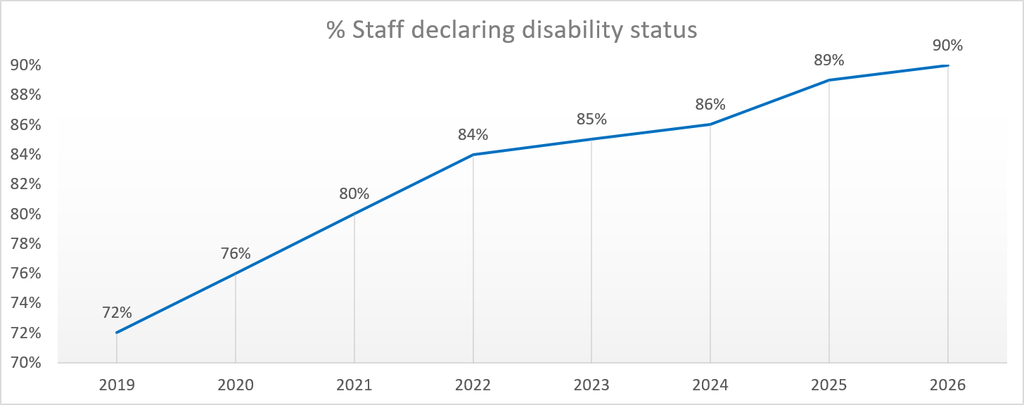
The chart shows the percentage of staff who have declared their disability status between 2019 and 2026.
Declaration has increased consistently across the period, rising from 72% in 2019 to 90% in 2026.
The largest increases occurred between 2019 and 2022. Declaration continued to improve thereafter, reaching 86% in 2024, 89% in 2025 and its highest level of 90% in 2026.
Recruitment – likelihood of an applicant without a disability being appointed from shortlisting compared to an applicant with a disability graph
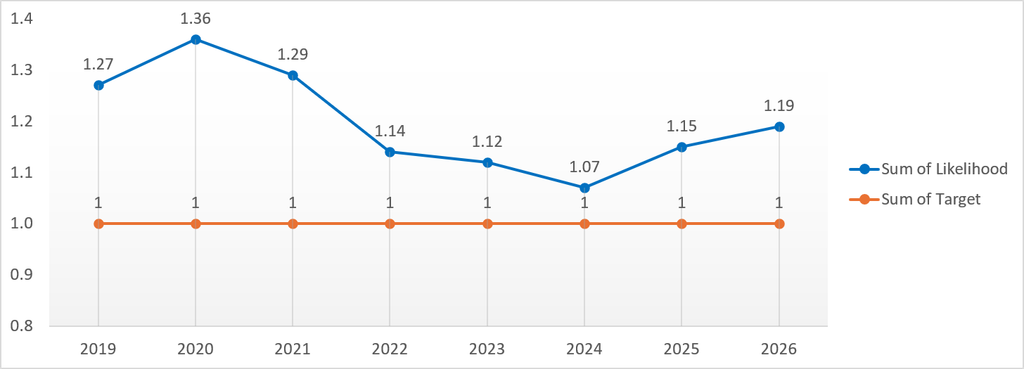
The chart shows the likelihood of an applicant without a disability being appointed from shortlisting compared with an applicant with a disability between 2019 and 2026. A value of 1.0 represents equal likelihood of appointment.
Applicants without a disability were more likely to be appointed in every year shown. The likelihood peaked at 1.36 in 2020, before generally reducing to 1.07 in 2024, the closest point to equal likelihood.
The figure has since increased to 1.15 in 2025 and 1.19 in 2026, indicating that a slight difference in appointment likelihood remains.
Capability – likelihood of someone with a disability entering the capability process compared to someone without a disability graph
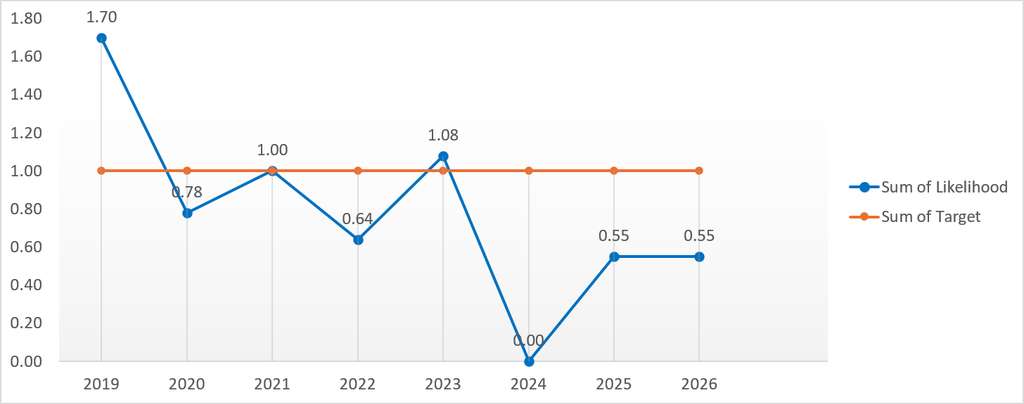
The chart shows the likelihood of staff with a disability entering the capability process compared with staff without a disability between 2019 and 2026. A value of 1.0 represents equal likelihood.
Although the position has fluctuated over time, the most recent data shows that disabled staff are less likely to enter the capability process than non-disabled staff.
Percentage of staff experiencing harassment, bullying or abuse from patients, relatives or the public in last 12 months graph
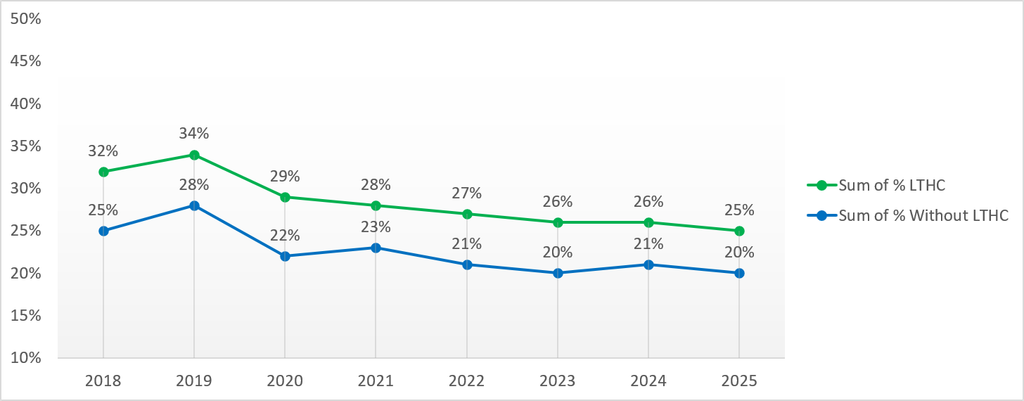
The chart shows the percentage of staff with a long-term health condition (LTHC) and staff without a long-term health condition who experienced harassment, bullying or abuse from patients, relatives or the public between 2018 and 2025.
Staff with a long-term health condition reported higher levels in every year shown.
Percentage of staff experiencing harassment, bullying or abuse from manager in the last 12 months graph
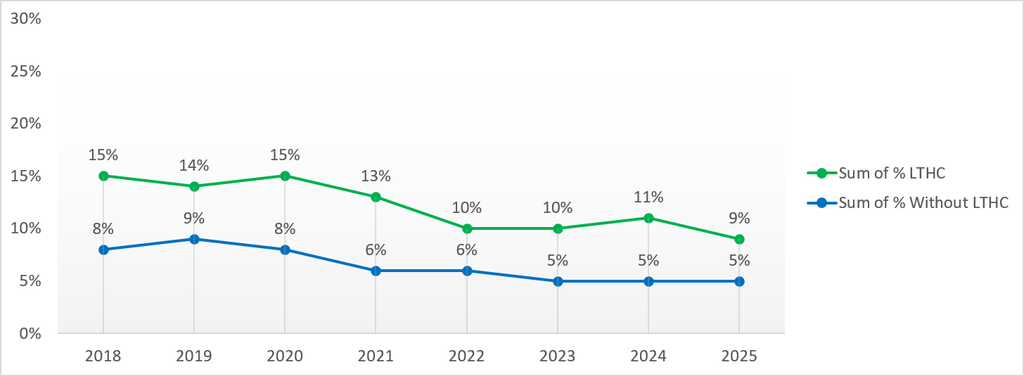
The chart shows the percentage of staff with and without a long-term health condition (LTHC) who reported experiencing harassment, bullying or abuse from a manager between 2018 and 2025.
Staff with a long-term health condition reported higher levels in every year shown. Both groups show an overall reduction over the period. For staff with a long-term health condition, the figure decreased from 15% in 2018 to 9% in 2025.
Percentage of staff experiencing harassment, bullying or abuse from colleagues in the last 12 months graph
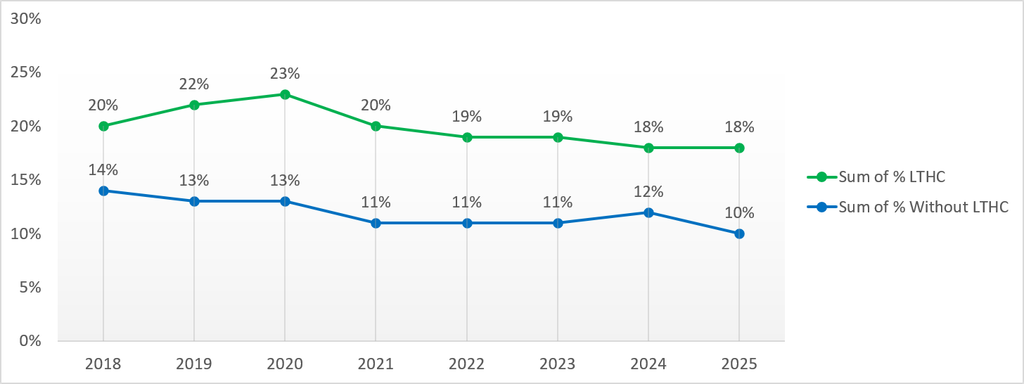
The chart shows the percentage of staff with and without a long-term health condition (LTHC) who reported experiencing harassment, bullying or abuse from colleagues between 2018 and 2025.
Staff with a long-term health condition reported higher levels in every year shown. The figure for staff with a long-term health condition peaked at 23% in 2020 and has generally reduced since, reaching 18% in 2025.
Percentage of staff that believe the Trust acts fairly with regards to career progression and promotion graph
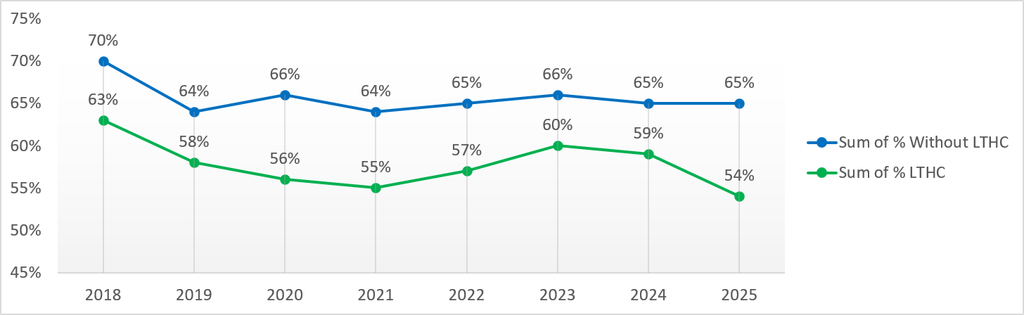
The chart shows the percentage of staff with and without a long-term health condition (LTHC) who believe the Trust acts fairly with regard to career progression and promotion between 2018 and 2025.
Staff with a long-term health condition reported less positive perceptions than staff without a long-term health condition in every year shown. In 2025, 54% of staff with a long-term health condition believed the Trust acts fairly, compared with 65% of staff without a long-term health condition.
Percentage who felt pressure from their manager to come to work, despite not feeling well enough to perform their duties graph
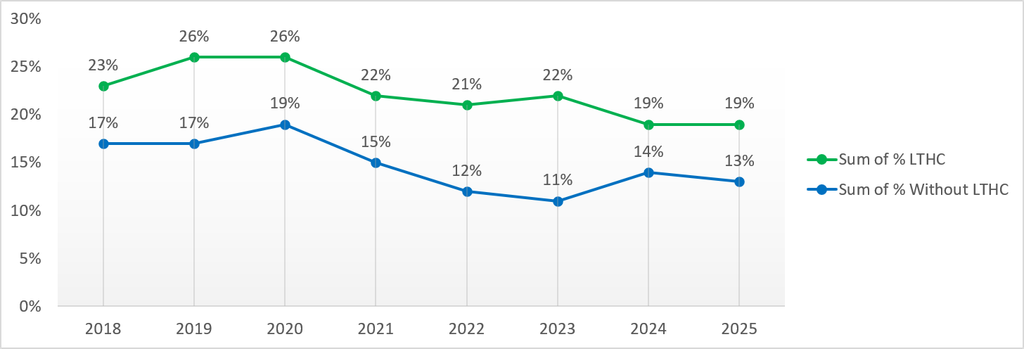
The chart shows the percentage of staff with and without a long-term health condition (LTHC) who felt pressure from their manager to come to work despite not feeling well enough to perform their duties between 2018 and 2025.
Staff with a long-term health condition reported higher levels in every year shown. For staff with a long-term health condition, the figure peaked at 26% in 2019 and 2020, before generally reducing to 19% in 2025.
Percentage satisfied with the extent to which their organisation values their work graph
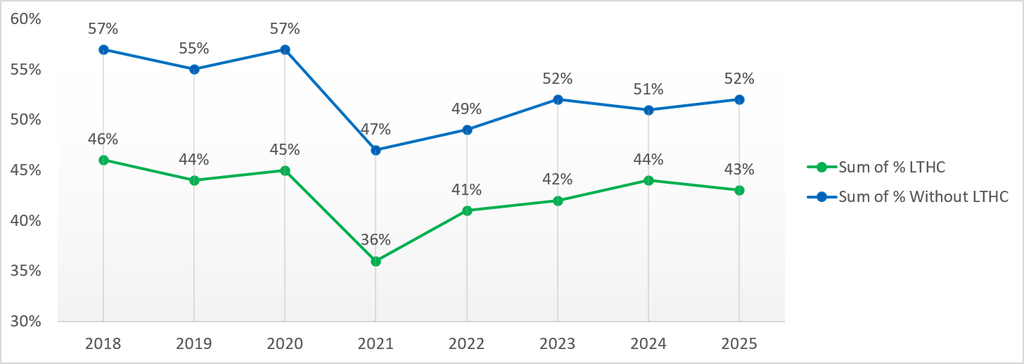
The chart shows the percentage of staff with and without a long-term health condition (LTHC) who were satisfied with the extent to which the organisation values their work between 2018 and 2025.
Staff with a long-term health condition reported lower levels of satisfaction in every year shown. Satisfaction among staff with a long-term health condition fell to 36% in 2021, before improving to 44% in 2024 and then decreasing slightly to 43% in 2025.
Among staff without a long-term health condition, satisfaction was 52% in 2025.
Percentage employer has made adequate adjustment(s) to enable them to carry out their work graph
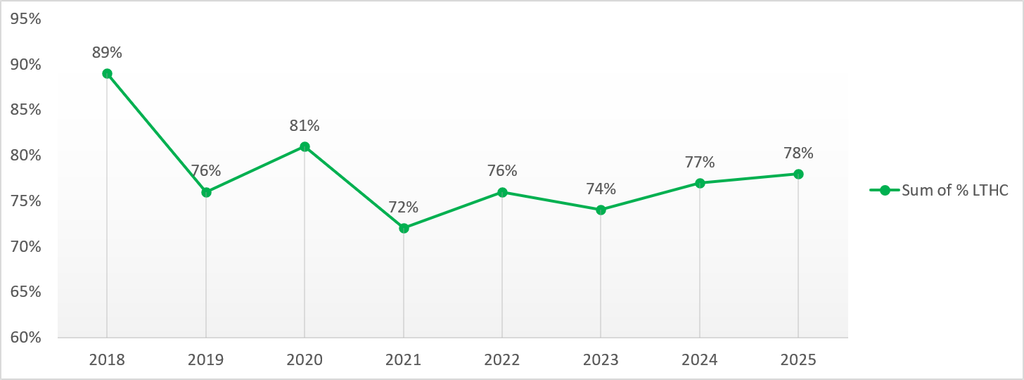
The chart shows the percentage of staff with a long-term health condition (LTHC) who reported that their employer had made adequate adjustments to enable them to carry out their work between 2018 and 2025.
The percentage has fluctuated over the period, from 89% in 2018 to a low of 72% in 2021. The position has improved in recent years, increasing from 74% in 2023 to 77% in 2024 and improving again to 78% in 2025.
Engagement Scores graph
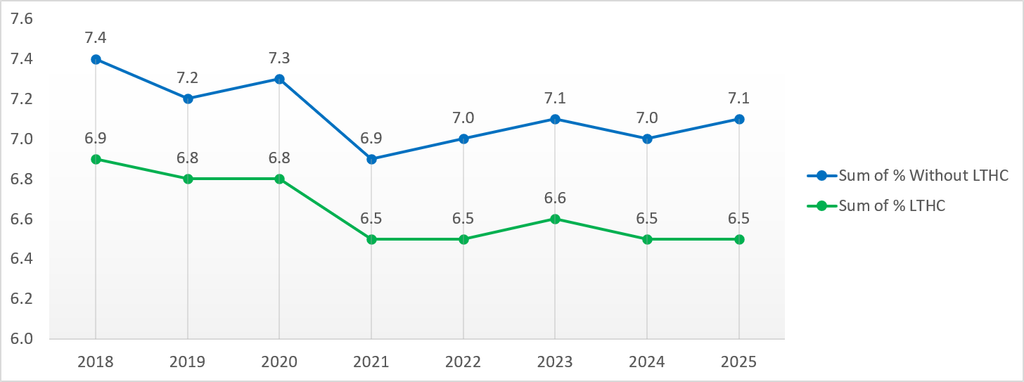
The chart compares engagement scores for staff with and without a long-term health condition (LTHC) between 2018 and 2025.
Staff with a long-term health condition had lower engagement scores in every year shown. Scores for both groups fell notably in 2021 and have remained relatively stable since.
In 2025, the engagement score for staff with a long-term health condition was 6.5, compared with 7.1 for staff without a long-term health condition.
Workforce Sexual Orientation Equality Standard (SOWES) 2026
SOWES summary
Workforce representation
- 5% of staff identify as Lesbian, Gay or Bisexual (LGB)
- 92% of staff have recorded their sexual orientation
Recruitment
Appointment rates from shortlisting were broadly similar, although heterosexual applicants were marginally more likely to be appointed than LGB applicants (1.19 times).
Disciplinary process
LGB staff are less likely to enter the disciplinary process compared to heterosexual staff (+ve position)
NHS staff survey insights
Harassment/bullying/abuse from patients/public:
- Bisexual: 19%
- Gay/Lesbian: 23%
- Heterosexual: 21%
Harassment/bullying/abuse from colleagues:
- Bisexual: 16%
- Gay/Lesbian: 17%
- Heterosexual: 12%
Discrimination from managers/colleagues:
- Bisexual: 10%
- Heterosexual: 6%
- Gay/Lesbian: 5%
Perception of fairness in career progression:
- Bisexual: 54%
- Heterosexual: 62%
- Gay/Lesbian: 62%
Board representation
0% of the Board identify as LGB
Gender identity
Staff who identify as not the same sex as assigned at birth report high levels of harassment, bullying and abuse:
- From patients/public: 33%
- From colleagues: 36%
- Discrimination from managers/team leader or colleagues: 17%
What we will do:
- Promote LGBTQ+ allyship across the Trust
- Strengthen and promote the LGBTQ+ Staff Network
- Increase understanding of LGBTQ+ staff experiences
- Review and update LGBTQ+ policies, guidance and resources
- Deliver LGBTQ+ inclusion training for managers and leaders
- Improve reporting, support and responses to discrimination, bullying and harassment
- Improve support for trans staff
- Increase awareness of Freedom to Speak Up and Respectful Resolution routes
- Improve leadership, development and career opportunities for LGBTQ+ staff
SOWES graphs
Percentage of staff declared sexual orientation graph
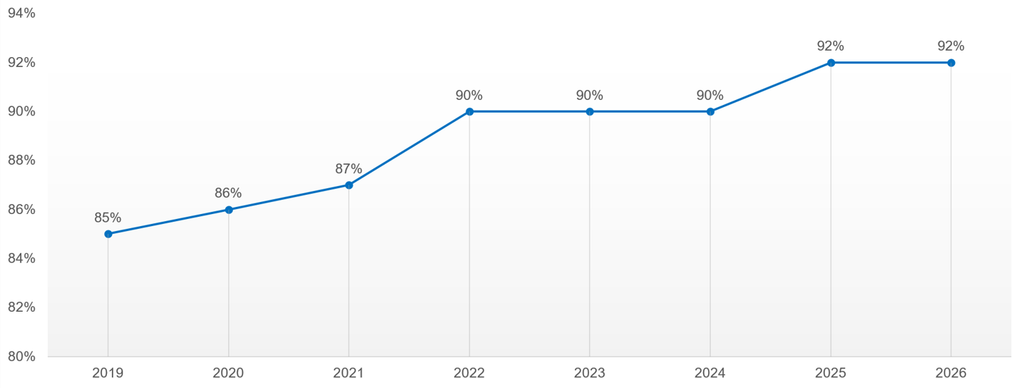
The chart shows the percentage of staff who declared their sexual orientation between 2019 and 2026.
Declaration has improved overall, increasing from 85% in 2019 to 92% in 2026. The rate increased steadily to 90% in 2022, remained at 90% through 2024, and then increased to 92% in 2025.
This improvement has been maintained in 2026 at 92%, the highest level shown.
Recruitment – likelihood of a heterosexual applicant being appointed from shortlisting compared to LBG applicant graph
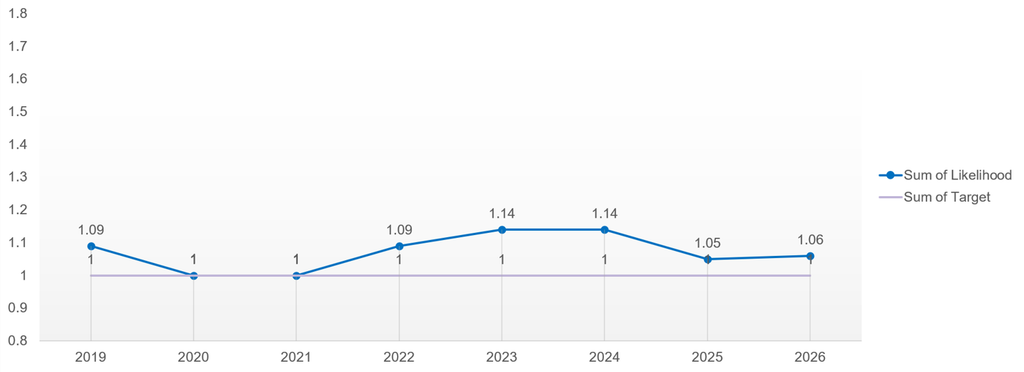
The chart shows the likelihood of a heterosexual applicant being appointed from shortlisting compared with an LGB applicant between 2019 and 2026. A value of 1.0 represents equal likelihood of appointment.
Appointment likelihood was equal in 2020 and 2021. In other years, heterosexual applicants were slightly more likely to be appointed. In the most recent years, the gap has narrowed, to 1.05 in 2025 and 1.06 in 2026, which is close to equal likelihood.
Disciplinary – likelihood of LGB staff entering the disciplinary processes compared to heterosexual staff graph
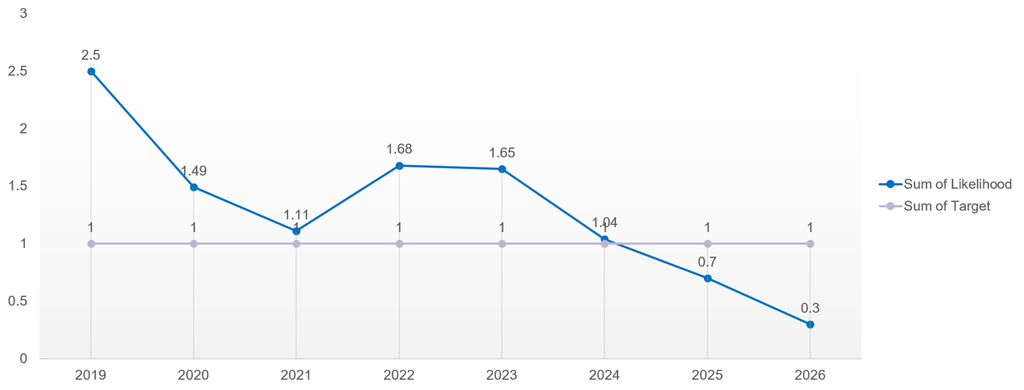
The chart shows the likelihood of LGB staff entering the disciplinary process compared with heterosexual staff between 2019 and 2026. A value of 1.0 represents equal likelihood.
LGB staff were more likely to enter the disciplinary process between 2019 and 2024, although the likelihood reduced considerably over this period, from 2.50 in 2019 to 1.04 in 2024. The position moved below equal likelihood in the two most recent years, falling to 0.70 in 2025 and 0.30 in 2026.
This means that, based on this measure, LGB staff were less likely than heterosexual staff to enter the disciplinary process in 2025 and 2026.
Percentage of staff experiencing harassment, bullying or abuse from patients, relatives or the public in last 12 months graph
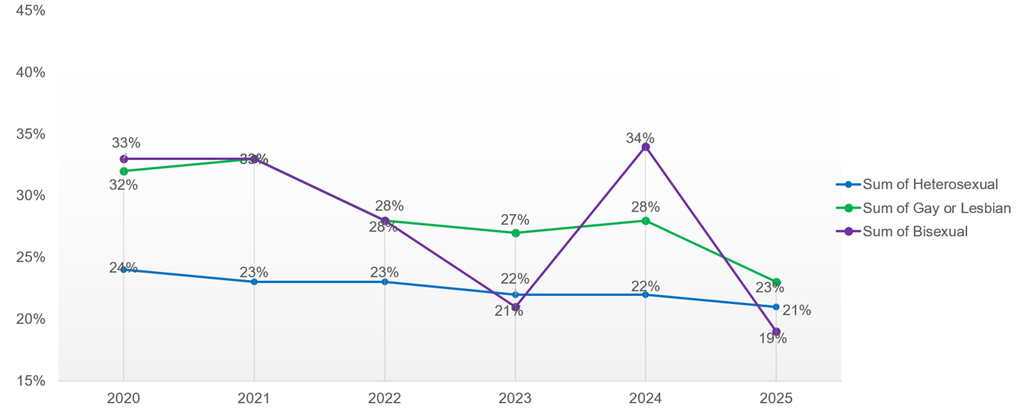
The chart shows the percentage of heterosexual, gay or lesbian, and bisexual staff who reported experiencing harassment, bullying or abuse from patients, relatives or the public between 2020 and 2025.
Experiences were generally higher among gay or lesbian and bisexual staff than heterosexual staff, although the pattern fluctuated. In 2025, the position improved for both gay or lesbian and bisexual staff.
Percentage of staff experiencing harassment, bullying or abuse from colleagues in the last 12 months graph
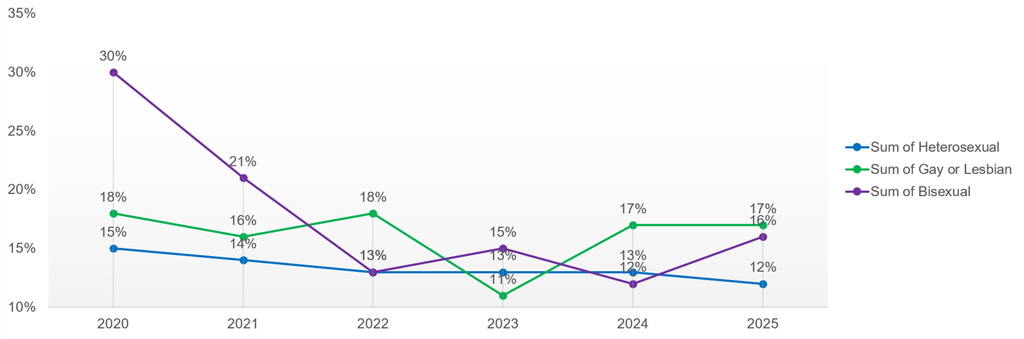
The chart shows the percentage of heterosexual, gay or lesbian, and bisexual staff who reported experiencing harassment, bullying or abuse from colleagues between 2020 and 2025.
Experiences vary across the three groups over time. In 2025, 17% of gay or lesbian staff and 16% of bisexual staff reported harassment, bullying or abuse from colleagues, compared with 12% of heterosexual staff.
The figure for bisexual staff increased from 12% in 2024 to 16% in 2025, while the figure for gay or lesbian staff remained unchanged at 17%. For heterosexual staff, the figure reduced from 13% to 12%.
Percentage of staff that believe the Trust acts fairly with regards to career progression and promotion graph
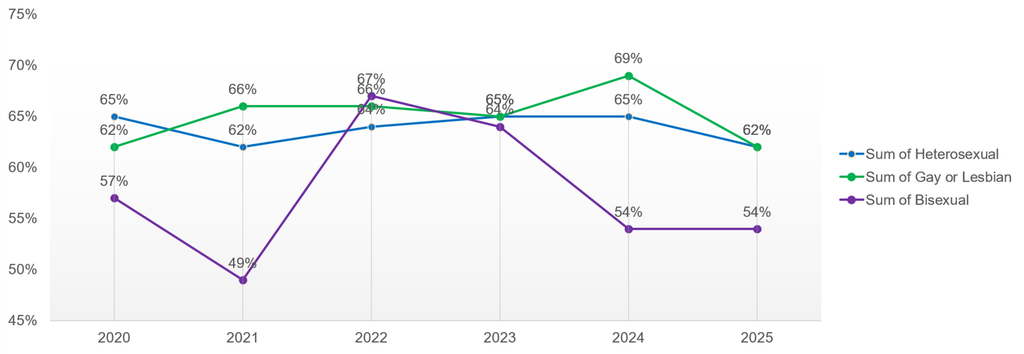
The chart shows the percentage of heterosexual, gay or lesbian, and bisexual staff who believe the Trust acts fairly with regard to career progression and promotion between 2020 and 2025.
Results fluctuate across the three groups, with bisexual staff showing the greatest variation over time. In 2025, 62% of heterosexual staff and 62% of gay or lesbian staff believed the Trust acts fairly, compared with 54% of bisexual staff.
Percentage who have personally experienced discrimination at work from manager/team leader or other colleagues in the last 12 months graph
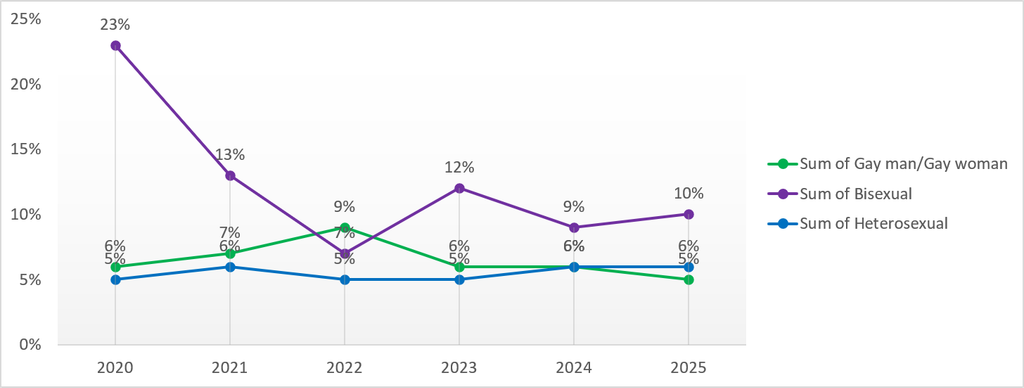
The chart shows the percentage of heterosexual, gay or lesbian, and bisexual staff who reported personally experiencing discrimination at work from a manager, team leader or other colleague between 2020 and 2025.
Bisexual staff reported the highest level in most years, although there has been a significant overall reduction from 23% in 2020 to 10% in 2025. In 2025, 10% of bisexual staff reported experiencing discrimination, compared with 5% of gay or lesbian staff and 6% of heterosexual staff.
Publication of Staff Equality Data (gender, age and religion) 2026
Publication of Equality Staff Information summary
Gender
Workforce representation
21.52% of the workforce are female and 78.48% are male
Recruitment disparity
Recruitment outcomes are generally equitable for men and women across the Trust.
Disciplinary action
Men are 2.85 times more likely to enter disciplinary processes.
NHS staff survey insights
Harassment/bullying/abuse from patients/public:
- Male: 26%
- Female: 21%
Harassment/bullying/abuse from colleague:
- Male: 11%
- Female: 13%
Discrimination from managers/colleagues:
- Male: 6%
- Female: 7%
Perception of fairness in career progression:
- Male: 60%
- Female: 62%
Board representation
22% of the Board are male which reflects the workforce
Age
Workforce representation
Workforce age profile: 16% age 21-30, 28% age 31-40, 24% age 41-50, 30% age 51-65, 2% 66+
Disciplinary action
The age breakdown of disciplinary cases shows the highest proportions among staff aged 45–64 and lowest in staff aged 16-24.
NHS staff survey insights
Harassment/bullying/abuse from patients/public:
- 16 to 20: 18%
- 21 to 30: 24%
- 31 to 40: 24%
- 41 to 50: 22%
- 51 to 65: 20%
- 66 plus: 13%
Harassment/bullying/abuse from colleague:
- 16 to 20: 0%
- 21 to 30: 12%
- 31 to 40:13%
- 41 to 50:14%
- 51 to 65:12%
- 66 plus: 9%
Discrimination from managers/colleagues:
- 16 to 20: 0%
- 21 to 30: 7%
- 31 to 40: 7%
- 41 to 50: 7%
- 51 to 65: 5%
- 66 plus: 8%
Perception of fairness in career progression:
- 16 to 20: 73%
- 21 to30: 61%
- 31 to 40: 64%
- 41 to 50: 61%
- 51 to 65: 58%
- 66 plus: 63%
Board representation
78% of the Board is aged 50-64
Religion
Workforce representation
Religions of workforce: Atheism: 21%, Christianity: 48%, Buddhism: 1%, Hinduism: 2%, Islam: 2%, other: 11%, undisclosed: 15%
NHS staff survey insights
Harassment/bullying/abuse from patients/public:
- No religion: 21%
- Christian: 22%
- Buddhist: 27%
- Hindu: 18%
- Muslim: 25%
- Other: 34%
- Prefer not to say: 24%
Harassment/bullying/abuse from colleague:
- No religion: 11%
- Christian: 13%
- Buddhist: 15%
- Hindu: 5%
- Muslim: 14%
- Other: 22%
- Prefer not to say: 23%
Discrimination from managers/colleagues:
- No religion: 5%
- Christian: 6%
- Buddhist: 15%
- Hindu: 8%
- Muslim: 16%
- Other: 19%
- Prefer not to say: 12%
Perception of fairness in career progression:
- No religion: 60%
- Christian: 65%
- Buddhist: 38%
- Hindu: 64%
- Muslim: 63%
- Other: 50%
- Prefer not to say: 41%
Board representation
The Board: 50% identify as Christian, 22% have not declared religion, 16% identify as other religion, 6% identify as Atheist, 6% as Hindu.
Publication of Staff Equality Data graphs
Percentage of staff experiencing harassment, bullying or abuse from patients, relatives or the public in last 12 months charts
Gender Chart
- Female: 23.24% (2021), 21.96% (2022), 21.90% (2024), 20.52% (2025)
- Male: 28.13% (2021), 27.61% (2022), 25.98% (2023), 25.84 (2024), 26.04 (2025)
- Non-binary: data not available (2021), 40.00% (2022), 0 (2023), 33.33% (2024), 25.00 (2025)
- Prefer to self-describe: data not available (2021), data not available (2022), 17.17% (2023), data not available (2024 and 2025)
- Prefer not to say: 24.69 (2021), 22.35% (2022), 17.99 (2023), 30.91 (2025)
The table shows the percentage of staff who reported experiencing at least one incident of harassment, bullying or abuse from patients, relatives or the public, broken down by gender, between 2021 and 2025.
In 2025, the percentage decreased for females to 20.52% and for non-binary staff to 25%, while the percentage for males increased slightly to 26.04%.
Age Chart
- Age 16 to 20: 60.00% (2021), – (2022), – (2023), – (2024), 18.18% (2025)
- Age 21 to 30: 28.66 (2021), 22.95% (2022), 21.61% (2023), 25.68% (2024), 24.01% (2025)
- Age 31 to 40: 23.66% (2021), 24.59% (2022), 25.57% (2023), 24.92 (2024), 23.69% (2025)
- Age 41 to 50: 23.43% (2021), 24.51% (2022), 22.70% (2023), 22.25% (2024), 21.57% (2025)
- Age 51 to 65: 24.20% (2021), 21.56% (2022), 20.63% (2023), 20.35% (2023), 20.03% (2025)
- Age 66 plus: 6.98% (2021), 16.95% (2022, 16.79% (2023), 12.50% (2024), 13.11% (2025)
The table shows the percentage of staff reporting at least one incident of harassment, bullying or abuse, from patients, relatives or the public, broken down by age group between 2021 and 2025.
In 2025, the highest percentage was among staff aged 21 to 30 at 24.01%, closely followed by those aged 31 to 40 at 23.69%. The lowest percentage was among staff aged 66 and over, at 13.11%.
Religion Chart
- No religion: 26.02% (2021), 23.01% (2022), 21.11% (2023), 22.01% (2024), 20.92% (2025)
- Christian: 21.89% (2021), 22.16% (2022), 23.33% (2023), 22.64% (2024), 22.11% (2025)
- Buddhist: 36.00% (2021), 21.74% (2022), 26.23% (2023), 26.67% (2024), 26.92% (2025)
- Hindu: 21.43% (2021), 35.00% (2022), 24.98% (2023), 26.92% (2024), 17.95% (2025)
- Jewish: – (2021 to 2025)
- Muslim: 41.67% (2021), 33.33% (2022), 34.52% (2023), 32.56% (2024), 24.56% (2025)
- Sikh: data not available (2021 to 2025)
- Any other religion: 31.25% (2021), 33.33% (2022), 25.64% (2023), 25.00% (2024), 34.38% (2025)
- I would prefer not to say: 27.54% (2021), 26.51% (2022), 23.07% (2023), 26.34% (2024), 24.23% (2025)
The table shows the percentage of staff reporting at least one incident of harassment, bullying or abuse, from patients, relatives or the public, broken down by religion or belief, between 2021 and 2025.
Results vary considerably between groups and across years. In 2025, the highest percentage was among staff identifying with any other religion at 34.38%, followed by Buddhist staff at 26.92% and Muslim staff at 24.56%. The lowest reported figure was among Hindu staff at 17.95%.
Percentage of staff experiencing harassment, bullying or abuse from colleague in the last 12 months charts
Gender Chart
- Female: 14.29% (2021), 13.79% (2022), 13.87% (2023), 13.93% (2024), 12.77% (2025)
- Male: 11.85% (2021), 11.09% (2022), 10.21% (2023), 11.00% (2024), 10.94% (2025)
- Non-binary: Data not available (2021), 20.00% (2022), data not available (2023), 18.18% (2024), 41.67% (2025)
- Prefer to self-describe: Data not available (2021 and 2022), 30.01% (2023), data not available (2024 and 2025)
- Prefer not to say: 25.93% (2021), 30.95% (2022), 32.84% (2023), 27.10% (2024), 20.13% (2025)
The table shows the percentage of staff reporting at least one incident of harassment, bullying or abuse, from a colleague, broken down by gender, between 2021 and 2025.
In 2025, the highest reported percentage was among non-binary staff at 41.67%, an increase from 18.18% in 2024. Female staff reported 12.77% in 2025, down from 13.93% in 2024, while male staff reported 10.94%, broadly unchanged from 11.00% in 2024.
Age Chart
- Age 16 to 20: 20.00% (2021), data not available (2022 to 2024), 0.00% (2025)
- Age 21 to 30: 11.33% (2021), 8.80% (2022), 11.51% (2023), 12.77% (2024), 12.34% (2025)
- Age 31 to 40: 14.80% (2021), 14.17% (2022), 12.24% (2023), 13.00% (2024), 12.78% (2025)
- Age 41 to 50: 15.95% (2021), 15.07% (2022), 16.19% (2023), 13.93% (2024), 13.57% (2025)
- Age 51 to 65: 13.32% (2021), 14.30% (2022), 13.63% (2023), 14.58% (2024), 12.46% (2025)
- Age 66 plus: 9.30% (2021), 12.28% (2022), 15.41% (2023), 20.00% (2024), 8.77% (2025)
The table shows the percentage of staff reporting at least one incident of harassment, bullying or abuse from a colleague, broken down by age group between 2021 and 2025.
In 2025, staff aged 41 to 50 reported the highest level at 13.57%, followed by staff aged 31 to 40 at 12.78%, staff aged 51 to 65 at 12.46%, and staff aged 21 to 30 at 12.34%.
Staff aged 66 and over reported 8.77%. Most age groups improved compared with 2024, with the largest reduction among staff aged 66 and over, falling from 20.00% to 8.77%.
Religion Chart
- No religion: 12.31% (2021), 12.08% (2022), 11.35% (2023), 12.22% (2024), 11.13% (2025)
- Christian: 13.60% (2021), 14.02% (2022), 14.59% (2023), 14.74% (2024), 12.86% (2025)
- Buddhist: 16.67% (2021), 17.39% (2022), 21.74% (2023), 13.33% (2024), 15.38% (2025)
- Hindu: 21.43% (2021), 30.00% (2022), 20.64% (2023), 11.54% (2024), 5.13% (2025)
- Jewish: Data not available for 2021 to 2025
- Muslim: 30.43% (2021), 17.39% (2022), 14.37% (2023), 14.29% (2024), 14.29% (2025)
- Sikh: Data not available for 2021 to 2025
- Any other religion: 25.53% (2021), 8.93% (2022), 11.10% (2023), 2.63% (2024), 21.88% (2025)
- I would prefer not to say: 26.95% (2021), 23.03% (2022), 24.62% (2023), 22.65% (2024), 22.66% (2025)
The table shows the percentage of staff reporting at least one incident of harassment, bullying or abuse from a colleague, broken down by religion or belief between 2021 and 2025.
In 2025, the highest reported percentage was among staff identifying with any other religion, at 21.88%, followed by Buddhist staff at 15.38% and Muslim staff at 14.29%. Staff who preferred not to state their religion reported 22.66%, broadly unchanged from 22.65% in 2024.
The largest improvement was for Hindu staff, decreasing from 11.54% in 2024 to 5.13% in 2025.
Percentage who have personally experienced discrimination at work from manager/team leader or other colleagues in the last 12 months charts
Gender Chart
- Female: 5.82% (2021), 5.09% (2022), 4.79% (2023), 6.30% (2024), 5.64% (2025)
- Male: 6.68% (2021), 5.67% (2022), 5.21% (2023), 6.63% (2024), 7.44% (2025)
- Non-binary: Data not available (2021), 20.00% (2022), data not available (2023), 16.67% (2024), 16.67% (2025)
- Prefer to self-describe: Data not available (2021 to 2022), (2022), 20.00% (2023), data not available (2024 to 2025)
- Prefer not to say: 17.28% (2021), 14.29% (2022), 15.32% (2023), 11.01% (2024), 11.88% (2025)
The table shows the percentage of staff who reported personally experiencing discrimination at work from a manager, team leader or other colleague, broken down by gender, between 2021 and 2025.
In 2025 the male figure increased from 6.63% in 2024 to 7.44% in 2025, whereas the female figure decreased from 6.30% to 5.64%.
Age Chart
- Age 16 to 20: 20.00% (2021), data not available (2022), data not available (2023), data not available (2024), 0.00% (2025)Age 21 to 30: 5.11% (2021), 4.11% (2022), 5.73% (2023), 7.52% (2024), 6.52% (2025)
- Age 31 to 40: 5.05% (2021), 5.34% (2022), 4.54% (2023), 5.19% (2024), 6.67% (2025)
- Age 41 to 50: 8.04% (2021), 5.56% (2022), 5.51% (2023), 6.64% (2024), 6.71% (2025)
- Age 51 to 65: 6.01% (2021), 5.35% (2022), 5.31% (2023), 7.08% (2024), 5.49% (2025)
- Age 66 plus: 8.00% (2021), 8.62% (2022), 6.67% (2023), 7.32% (2024), 8.33% (2025)
The table shows the percentage of staff who reported personally experiencing discrimination at work from a manager, team leader or other colleague, broken down by age group between 2021 and 2025.
In 2025, staff aged 66 and over reported the highest level of discrimination at 8.33%, followed by staff aged 41 to 50 at 6.71% and staff aged 31 to 40 at 6.67%. Staff aged 21 to 30 reported 6.52%, while staff aged 51 to 65 reported 5.49%.
Compared with 2024, discrimination reduced for staff aged 21 to 30 and 51 to 65, but increased for staff aged 31 to 40, 41 to 50 and 66 and over.
Religion Chart
- No religion: 4.64% (2021), 4.61% (2022), 3.54% (2023), 4.97% (2024), 4.85% (2025)
- Christian: 6.46% (2021), 5.40% (2022), 5.79% (2023), 6.96% (2024), 6.16% (2025)
- Buddhist: 11.54% (2021), 4.35% (2022), 12.50% (2023), 13.33% (2024), 15.38% (2025)
- Hindu: 14.29% (2021), 20.00% (2022), 7.14% (2023), 7.69% (2024), 7.89% (2025)
- Jewish: Data not available for 2021 to 2025
- Muslim: 8.00% (2021), 12.50% (2022), 13.89% (2023), 20.93% (2024), 15.79% (2025)
- Sikh: Data not available for 2021 to 2025
- Any other religion: 22.00% (2021), 8.77% (2022), 9.09% (2023), 7.50% (2024), 19.35% (2025)
- I would prefer not to say: 12.14% (2021), 8.48% (2022), 10.77% (2023), 12.50% (2024), 12.36% (2025)
The table shows the percentage of staff who reported personally experiencing discrimination at work from a manager, team leader or other colleague, broken down by religion or belief between 2021 and 2025.
In 2025, the highest reported percentages were among staff identifying with any other religion at 19.35%, Muslim staff at 15.79% and Buddhist staff at 15.38%. Muslim staff show an improvement from 2024, decreasing from 20.93% to 15.79%.
In contrast, staff identifying with any other religion increased substantially from 7.50% in 2024 to 19.35% in 2025, and Buddhist staff increased from 13.33% to 15.38%. The lowest percentage in 2025 was among staff reporting no religion, at 4.85%.
Staff Engagement Score Charts
Gender Chart
- Female: 6.89 (2021), 6.99 (2022), 7.03 (2023), 6.96 (2024), 6.95 (2025)
- Male: 6.55 (2021), 6.47 (2022), 6.76 (2023), 6.73 (2024), 6.80 (2025)
- Non-binary: Data not available (2021), 6.22 (2022), 5.39 (2023), 6.83 (2024), 6.13 (2025)
- Prefer to self-describe: Data not available (2021 and 2022), 5.11 (2023), data not available (2024 and 2025)
- Prefer not to say: 5.62 (2021), 5.48 (2022), 5.74 (2023), 5.50 (2024), 5.79 (2025)
The table shows Staff Engagement Scores out of 10, broken down by gender, between 2021 and 2025. In 2025, female staff reported the highest engagement score at 6.95, followed by male staff at 6.80.
The score for non-binary staff was lower at 6.13, while staff who preferred not to state their gender reported the lowest score at 5.79. Compared with 2024, engagement improved slightly for male staff and those who preferred not to say, remained broadly stable for female staff, and decreased for non-binary staff from 6.83 to 6.13.
Age Chart
- Age 16 to 20: 6.17 (2021), data not available (2022 to 2024), 6.72 (2025)
- Age 21 to 30: 6.85 (2021), 7.00 (2022), 6.99 (2023), 6.73 (2024), 6.70 (2025)
- Age 31 to 40: 6.73 (2021), 6.80 (2022), 6.91 (2023), 6.89 (2024), 6.87 (2025)
- Age 41 to 50: 6.81 (2021), 6.80 (2022), 6.98 (2023), 6.90 (2024), 6.96 (2025)
- Age 51 to 65: 6.79 (2021), 6.88 (2022), 6.92 (2023), 6.87 (2024), 6.87 (2025)
- Age 66 plus: 7.16 (2021), 6.94 (2022), 6.77 (2023), 7.27 (2024), 7.00 (2025)
The table shows Staff Engagement Scores out of 10, broken down by age group between 2021 and 2025.
In 2025, staff aged 66 and over had the highest engagement score at 7.00, followed by staff aged 41 to 50 at 6.96. Staff aged 31 to 40 and 51 to 65 both scored 6.87, while staff aged 16 to 20 scored 6.72 and staff aged 21 to 30 scored 6.70.
Compared with 2024, engagement improved for staff aged 41 to 50, remained unchanged for staff aged 51 to 65, and decreased slightly for the other age groups where comparable data is available.
Religion Chart
- No religion: 6.67 (2021), 6.77 (2022), 6.89 (2023), 6.80 (2024), 6.80 (2025)
- Christian: 6.98 (2021), 6.99 (2022), 7.07 (2023), 7.06 (2024), 7.07 (2025)
- Buddhist: 6.30 (2021), 6.34 (2022), 7.55 (2023), 6.88 (2024), 6.43 (2025)
- Hindu: 7.42 (2021), 7.72 (2022), 7.64 (2023), 7.44 (2024), 7.49 (2025)
- Jewish: Data not available for 2021 to 2025
- Muslim: 7.60 (2021), 7.33 (2022), 7.81 (2023), 7.28 (2024), 7.20 (2025)
- Sikh: Data not available for 2021 to 2025
- Any other religion: 6.45 (2021), 6.97 (2022), 6.55 (2023), 6.42 (2024), 6.16 (2025)
- I would prefer not to say: 6.00 (2021), 6.01 (2022), 6.07 (2023), 5.92 (2024), 6.01 (2025)
The table shows Staff Engagement Scores out of 10, broken down by religion or belief between 2021 and 2025.
In 2025, Hindu staff recorded the highest engagement score at 7.49, followed by Muslim staff at 7.20 and Christian staff at 7.07. Staff reporting no religion scored 6.80, while Buddhist staff scored 6.43. The lowest scores were among staff identifying with any other religion at 6.16 and those who preferred not to state their religion at 6.01.
Compared with 2024, scores improved slightly for Hindu and Christian staff and those who preferred not to say, remained unchanged for staff with no religion, and decreased for Buddhist, Muslim and other religion groups.


