The download above may not be suitable for users of assistive technology. For that reason, we have also included the contents of the report on this webpage.
In June 2023 the Equality, Diversity and Inclusion Plan set out six targeted actions to address direct and indirect prejudice and discrimination, that exists through behaviour, policies, practices and cultures against certain groups and individuals across the NHS workforce. High Impact action 3 requires us to develop and implement an improvement plan to eliminate pay gaps.
We are required to analyse data to understand pay gaps by protected characteristic and put in place an improvement plan. This will be tracked and monitored by NHS boards. Plans were put in place for sex and race by 2024, disability by 2025 and other protected characteristics by 2026. The Trust already report on gender pay gaps.
A pay gap is the difference between the average hourly pay of employees in one group in comparison to another group. For example, women in comparison to men or LGBTQ+ in comparison to heterosexual.
This is different to equal pay. Equal pay is a person being paid the same for the same role and it is unlawful to pay someone differently for doing the same job based on a protected characteristic.
The Trust is committed to understanding any differences identified in the ethnicity pay report and will undertake further analysis to gain a better understanding as to the reason for the differences and to take action where appropriate. Pay gaps can negatively affect the retention of the NHS workforce. They can make it harder to recruit and can have a detrimental impact on staff experience when in post.
This is our second ethnicity pay gap report. We have analysed information using the categories: White, Not Stated (which includes not known) and BAME. BAME is all other ethnic minority groups combined. At this stage we have not broken down BAME any further due to the small numbers in each category and recommendations are that there should be at least 50 staff in each group to ensure statistical robustness.
Guidance on ethnicity pay gaps has been produced in May 2023 with recommendations as to what metrics organisations can consider using to measure their ethnicity pay gap. We have applied the calculations and analysis methods used in Gender Pay Gap reporting.
It is recommended that we review the mean and median ethnicity pay gaps, mean and median bonus gaps and proportions of ethnicities in each quartile of pay bands.
Under the regulations, payments that would fall under the remit of a bonus includes Clinical Excellence Awards for consultants and Long Service Awards.
Finally, it is important to note that analysis of pay gaps are multi-dimensional and complex. Undertaking pay gap reports helps us to identify where pay differences exist and identify actions to understand those disparities better. Reporting annually is an important step to allow us to see how our pay disparities are changing.
The ethnicity profile of the Trust 2024
- BAME: 8%
- Not Stated: 1.3%
- White: 90.7%
Please note these figures exclude bank workers. The remainder of the report includes data pertaining to substantive staff plus any bank workers who worked on 31 March 2024.
Mean and Median Ethnicity Pay Gap
The mean ethnicity pay gap and median ethnicity pay gap for all employees is detailed below. Gross pay calculations are used for these purposes. This includes enhancements, clinical excellence awards and long service awards. Overtime payments are excluded from these calculations.
In line with guidance, only staff on full pay are included in the calculations therefore staff on reduced pay for sickness, maternity or other reasons are excluded. Staff who did not state their ethnicity or are classified as unknown are not included within these figures.
2024 mean average hourly pay
Overall
- White: £18.57
- BAME: £20.95
- Difference: -£2.38
- Gap: -12.80%
Non-medical and exec
- White: £17.87
- BAME: £15.56
- Difference: £2.31
- Gap: 12.94%
Medical only
- White: £48.49
- BAME: £40.93
- Difference: £7.56
- Gap: 15.59%
The overall figures show that BAME staff are paid higher than white staff by £2.38.
By breaking down the pay gap to non-medical and staff on Very Senior Manager (VSM) pay and medical separately it can be seen that there is an ethnicity pay gap evident. The reason for this difference is that overall, we have a low number of BAME staff employed compared to white staff. This impacts on the average hourly pay of that group of staff compared with the average hourly rates of the much larger white workforce in each grade.
Also, our BAME workforce has a significantly higher proportion of medics within it which results in a higher average hourly rate.
The overall median ethnicity pay gap table below also appears to demonstrate that there is an ethnicity pay gap between white and BAME staff and that white staff are paid higher than BAME staff by £3.17. A breakdown by non-medical and VSM pay and medical also shows that a pay gap exists.
2024 median average hourly pay
Overall
- White: £17.73
- BAME: £14.57
- Difference: £3.17
- Gap: 17.85%
Non-medical and exec
- White: £17.73
- BAME: £14.15
- Difference: £3.58
- Gap: 20.20%
Medical only
- White: £52.11
- BAME: £39.62
- Difference: £12.50
- Gap: 23.98%
In addition to the proportion of BAME staff employed by the Trust, there are other possible contributory factors which can influence the pay gap differences. The Trust operates a number of salary sacrifice schemes which affords staff the opportunity to purchase vouchers towards childcare costs, purchase a cycle, electrical goods or a lease car.
The costs associated with salary sacrifice schemes are deducted prior to calculating gross pay. This will have an impact on the gross pay calculations undertaken to determine the mean and median ethnicity pay gap and will be one of a number of contributory factors which may be causing the differences being reported.
2024
| Ethnicity | Count of Employee Number | % |
|---|---|---|
| BAME | 87 | 5.3% |
| White | 1479 | 90% |
| Not stated | 77 | 4.3% |
| Grand Total | 1632 | 100 |
The numbers of BAME staff who have salary sacrifice deductions is very low, with 87 staff accessing this benefit compared with 1479 white staff. BAME staff accessing the scheme equates to 5.3% of all salary sacrifices within the Trust which shows BAME staff are less likely to access salary sacrifices.
A breakdown by type of salary sacrifice for BAME staff has not been provided due to staff being potentially identifiable due to the low numbers involved.
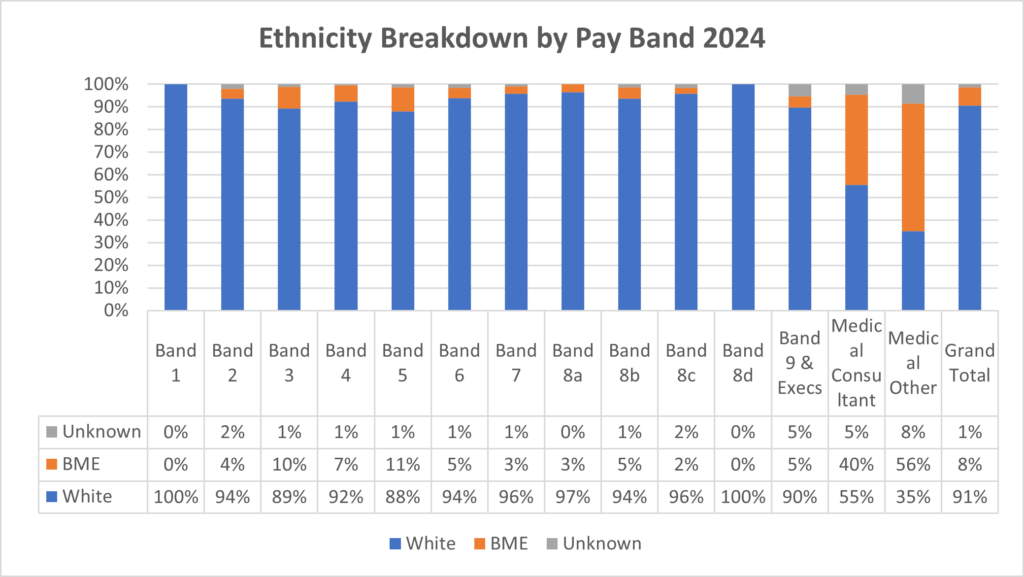
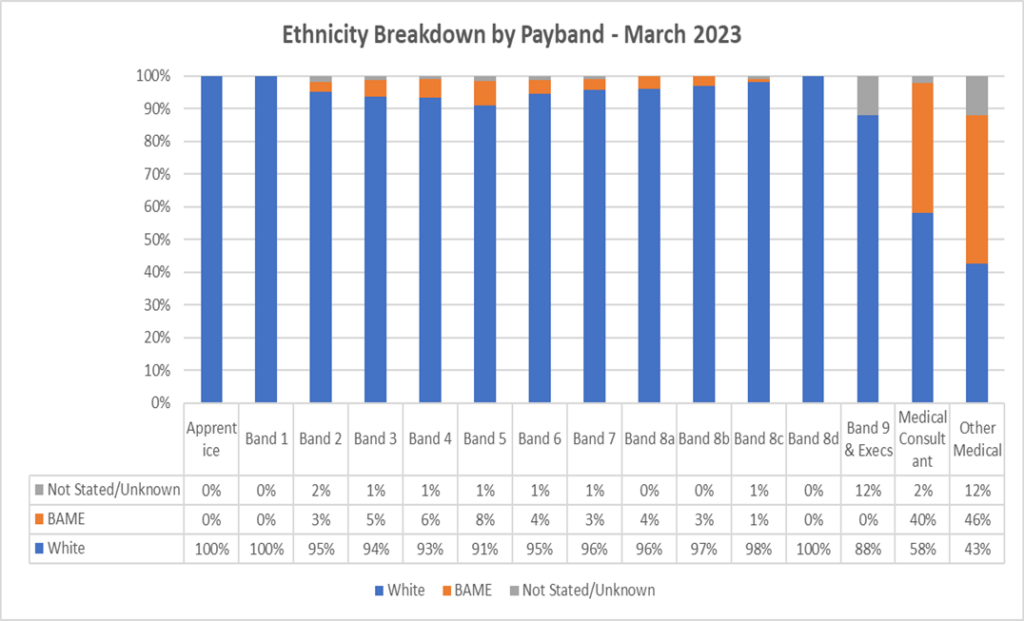
Ethnicity Breakdown by Pay Band
The following graph provides a breakdown of ethnicity by pay band. It is clear that largest numbers of our BAME workforce are within the medical workforce.
Band 1 was closed to new entrants from 1 December 2018, therefore the number of overall staff in this banding will continue to reduce.
2024
2023
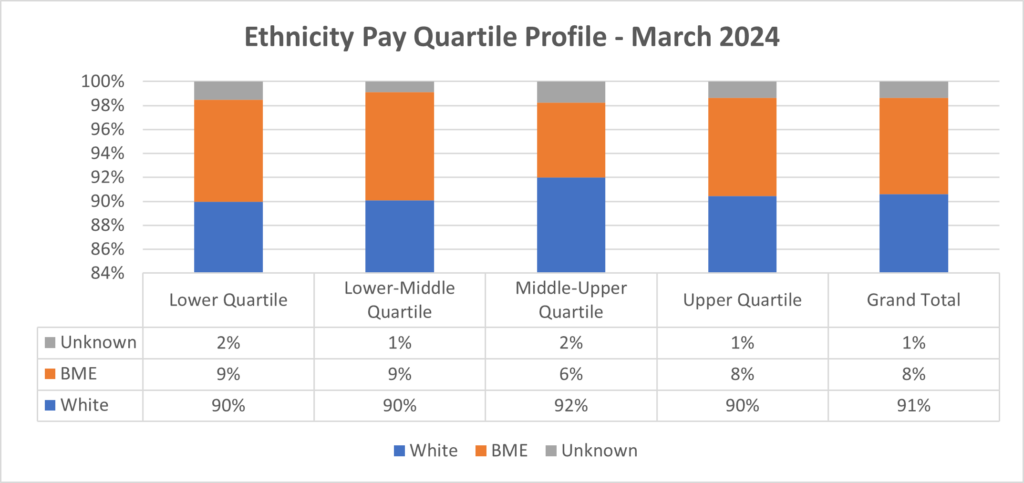
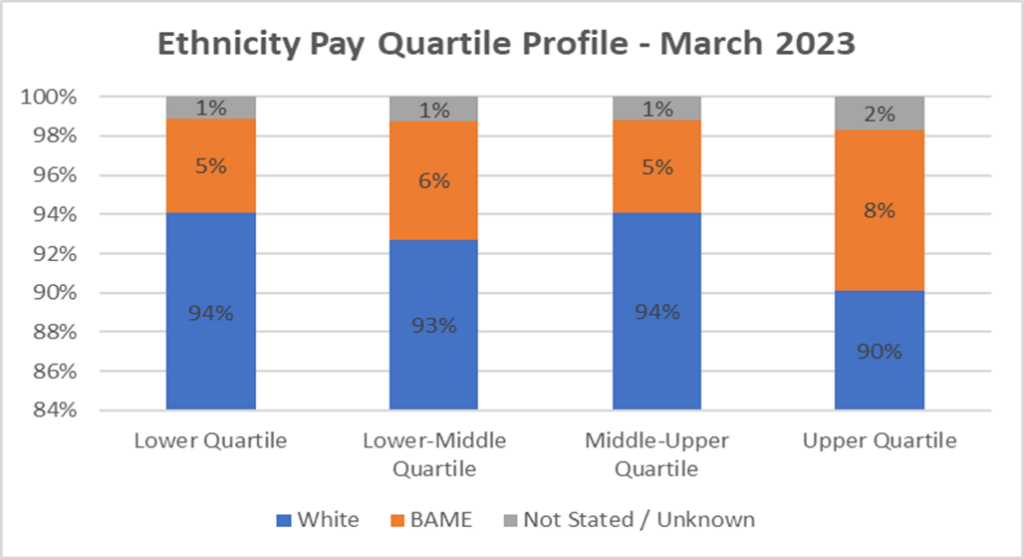
Ethnicity Pay Quartile Profile
The following graph shows the proportion of staff by ethnicity in each pay quartile. The lower quartile represents the lowest salaries in the Trust and the upper quartile represents the highest salaries. The Trust employs more white staff than BAME staff in every quartile. The highest percentage of BAME staff are within the lower quartile and lower-middle quartile.
2024
2023
Bonus Payments
Under the regulations, payments that would fall under the remit of bonus would include Clinical Excellence Awards for consultants and Long Service Awards.
Clinical Excellence Awards (CEA)
Under the national Medical & Dental terms and conditions consultants are eligible to apply for Clinical Excellence Awards (CEA). These awards recognise individuals who demonstrate achievements in developing and delivering high quality patient care over and above the standard expected of their role and are part of a commitment to the continuous improvement of the NHS.
At the time of reporting the Trust was operating a local clinical excellence award scheme based on the national terms and conditions. For the 2024 award year it was agreed locally that due to industrial action that the Trust would follow the same process as that which took place in the preceding years linked with the pandemic. This meant that the Trust could again stand down the usual formal process of application and review for CEA’s. Instead, the money could be divided equally between all eligible individuals, and they received a non-consolidated and non-pensionable payment for the year. Therefore, everyone received the same amount of award for 2024.
There are also however several individuals receiving historic awards from 2017 which are recurrently paid each year. Once an award had been made the consultant continues to receive that level of award going forward. A further submission may be made the following year and as a consequence progression through the varying payment levels occurred.
As part of the new terms and conditions following agreement to the pay settlement, from 1st April 2024 the contractual entitlement to access annual CEA awards stopped. Therefore, there will be no new award rounds. Any doctor who has a pre-2018 CEA will be retained and remain pensionable and consolidated. The value of these awards will be frozen, and the review process has been removed. These changes will impact on future pay gap reports.
Based on current guidance the table below shows the mean and median bonus pay linked to clinical excellence awards only.
| Ethnicity | Mean Bonus Pay | Median Bonus Pay |
|---|---|---|
| White | £6,408 | £2,666 |
| BAME | £7,448 | £5,682 |
| Difference | -£1,040 | -£3,016 |
| Pay Gap % | -16.23% | -113.12% |
All of the Trust eligible 114 Consultants received a Clinical Excellence Award in the reporting year. 68 were white (59.6%), 41 were from BAME backgrounds (36%) and 5 had not stated / unknown ethnic origins (4.4%).
The data suggests that white consultants are paid less CEA amounts compared with BAME consultants. However, due to the small number of staff receiving these payments, one or 2 staff with high or low CEA levels can have a significant impact on the overall averages.
Long Service Awards
The Trust operates a locally agreed long service award scheme to recognise the service of staff who have 25 years NHS service. The award is a £100 gift voucher. In the reporting period a total of 167 staff received an award. Of which 157 were White (94%), 7 were from a BAME background (4.2%) and 3 had not stated their ethnicity (1.8%).
Whilst the percentage of BAME staff receiving a long service award has increased from last year (2.5 %) it is disproportionately low compared with the 8% of the Trust workforce that the BAME workforce make up.
Under the Regulation we are required to include payments which relate to profit sharing, productivity, performance, incentive or commission should be included in the bonus calculations. It could be argued long service awards do not provide the incentive usually associated with the criteria outlined above. Guidance from ACAS states that such payments with a monetary value should be included in the bonus calculations.
Total Bonus Payments
The table below provides combined details of the clinical excellence awards and long service awards. It should be noted that the numbers of BAME staff involved in these calculations is very low and overall, as a proportion of the workforce, the numbers of staff receiving bonus’s as per these guidelines is very small. These payments are also not pro-rated.
When combining CEA and long service awards, this data suggests that BAME staff receive higher pay than white staff in relation to bonus.
| Ethnicity | Mean Bonus Pay | Median Bonus Pay |
|---|---|---|
| White | £2,006 | £100 |
| BAME | £6,512 | £2,666 |
| Difference | -£4,506 | -£2,566 |
| Pay Gap % | -224.58% | -2566.20% |
Overall percentage of receiving bonus payments
The guidance requires us to calculate the percentage of white and BAME staff who have received a bonus as a percentage of all employed white and BAME staff (not just those on full pay which other aspects of the reporting require us to do).
7.3% of BAME staff received a bonus in 2024 compared to 8.3% in 2023.
3.02% of white staff received a bonus in 2024 compared to 2.4% in 2023.
The difference in percentages will be linked to the proportion of the BAME workforce which are medical and are therefore eligible for clinical excellence awards.
Key Findings:
- The number of BAME staff within the organisation is low and a high percentage of the BAME workforce in the Trust are medical. Therefore, when calculating average pay for BAME staff, data could be skewed by smaller numbers of higher paid staff.
- Whilst overall data shows that BAME staff average hourly pay is higher than white staff, when separating non-medical & executive pay and medical pay grades the data shows that there is a pay gap evident in both groups.
- Similar to last year our BAME consultants are receiving higher bonus payments.
- Proportionally, fewer BAME staff were eligible for long service awards.
- Very low levels of BAME staff are within higher bands, (excluding medical grades).
Proposed Areas for Further Action Specific to the Ethnicity Pay Gap Report:
- To explore the reasons for low numbers of BAME staff being eligible for long service awards and if this is linked with retention of our BAME workforce in the NHS and associated reasons.
- Explore if there are any reasons for the lower numbers of BAME staff in certain pay grades within the Trust.