The download above may not be suitable for users of assistive technology. For that reason, we have also included the contents of the report on this webpage.
The Equality Act 2010 (Specific Duties and Public Authorities) Regulations 2017 introduced a statutory requirement to produce information outlining details of any gender pay differences that exist within an organisation. As from April 2018 public, private and voluntary sector organisations with 250 or more employees were required to report on their gender pay gaps using six different measures.
This is the eighth report and is based upon a snapshot date of 31st March 2025. We are required to publish data on the Government Equalities Office website and on the Trust website by 30th March 2026 and annually going forward.
The gender pay gap shows the difference between the average (mean or median) earnings of men and women. This is expressed as percentage of men’s earnings for example, women earn 15% less than men.
The gender pay gap differs from equal pay in the following way. Equal pay deals with the pay differences between men and women who carry out the same jobs, similar jobs or work of equal value. It is unlawful to pay people unequally because they are a man or a woman. The gender pay gap shows the differences in the average pay between men and women.
The following report includes the statutory requirements of the gender pay gap reporting legislation along with further context to demonstrate our commitment to equality.
Pay gaps can negatively affect the retention of the NHS workforce. They can make it harder to recruit and can have a detrimental impact on staff experience when in post.
The Trust is committed to understanding any differences identified in the gender pay report and will undertake further analysis to gain a better understanding as to the reason for the differences and to take action where appropriate.
Finally, it is important to note that analysis of pay gaps are multi-dimensional and complex. Undertaking pay gap reports helps us to identify where pay differences exist and identify actions to understand those disparities better.
Reporting annually is an important step to allow us to see how our pay disparities are changing.
The gender profile of the Trust 2025
- Female: 78.0%
- Male: 22.0%
The gender profile split in the Trust has changed with the proportion of females decreasing from 80% in 2024 to 78% in 2025, while the proportion of males has increased from 20% in 2024 to 22% in 2025.
Please note these figures exclude bank workers. The remainder of the report includes data pertaining to substantive staff plus any bank workers who worked on 31 March 2025. This is in accordance with the Gender Pay Gap reporting requirements.
In line with gender pay gap reporting we are required to report annually on the following:
- Mean gender pay gap
- Median gender pay gap
- Mean bonus gender gap *
- Median bonus gender gap *
- The proportion of males receiving a bonus payment *
- The proportion of females receiving a bonus payment *
- Proportions of males and females in each quartile of pay band
*Under the regulation payments that would fall under the remit of bonus would include Clinical Excellence Awards for consultants and Long Service Awards.
Mean and Median Gender Pay Gap
- Mean Gender Pay Gap: Females 11.56% less than males – equating to £2.59 per hour less
- Median Gender Pay Gap: Females 2.03% less than males – equating to £0.38 per hour less
The mean gender pay gap and median gender pay gap for all employees is detailed below. Gross pay calculations are used for these purposes.
In line with guidance, only staff on full pay are included in the calculations therefore staff on reduced pay for sickness, maternity or other reasons are excluded. Overtime payments are also excluded from these calculations.
2025
| Mean | Gender | Mean Hourly Pay | Difference | Gap |
| Overall | Male | £22.41 | £2.59 | 11.56% |
| Female | £19.82 | |||
| Median | Gender | Median Hourly Pay | Difference | Gap |
| Overall | Male | £18.67 | £0.38 | 2.03% |
| Female | £18.29 |
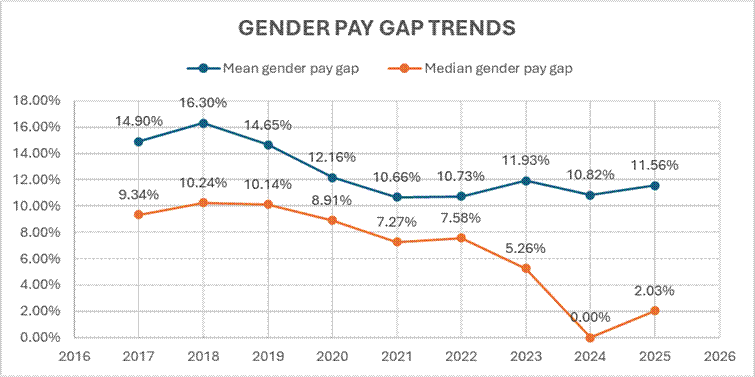
The mean gender pay gap linked to the amount a female is paid has increased in the past year from 10.82% in 2024 to 11.56% in 2025. From an hourly rate perspective this equates to a mean gender pay gap increase in the past year from £2.23 per hour to £2.59 per hour less than males.
The median gender pay gap has increased from 0.00% in 2024 to 2.03% in 2025, which from an hourly rate perspective equates to a median gender pay gap change in the past year from £0.00 per hour to £0.38 per hour less than males.
The graph below highlights the mean and median gender pay gap reported figures between March 2017 and March 2025 for comparison purposes.
2025
There are several possible contributory factors which can influence the gender pay gap differences. The Trust operates a number of salary sacrifice schemes which affords staff the opportunity to purchase vouchers towards childcare costs, purchase a cycle, electrical goods or a lease car.
The costs associated with salary sacrifice schemes are deducted prior to calculating gross pay. This will have an impact on the gross pay calculations undertaken to determine the mean and median gender pay gap and will be one of a number of contributory factors which may be causing the differences being reported.
It is important to note that some staff have more than one salary sacrifice in place (some have up to five) and that amounts of deductions can vary considerably.
| Row Labels | Count of Employee Number | % |
| Female | 1343 | 78.54 |
| Male | 367 | 21.46 |
| Grand Total | 1710 | 100 |
As you would expect, in line with the gender split within the organisation, the majority of staff opting to participate in one or more salary sacrifice schemes are female (accounting for 78.54% of the salary sacrifices).
Agenda for Change and Very Senior Manager Pay
When medical staff are removed from the calculations, the gender pay gap decreases which is common amongst NHS Trusts. The mean and median gender pay gaps for those staff employed on Agenda for Change terms and conditions and Very Senior Managers (VSM) Pay is detailed below.
- Mean Gender Pay Gap: 3.31% less than males – equating to £0.65 per hour less
- Median Gender Pay Gap: 0.24% less than males – equating to £0.04 per hour less
Comparing this 2025 data with the previous year shows the mean gender pay for staff on AFC & VSM pay has increased from the previous year from 1.75% in 2024 to 3.31%. The median gender pay gap has decreased from 13.43% in 2024 to 0.24%
AFC and VSM – 2025 data
| Mean | Gender | Mean Hourly Pay | Difference | Gap |
| Overall | Male | £19.79 | £0.65 | 3.31% |
| Female | £19.14 | |||
| Median | Gender | Median Hourly Pay | Difference | Gap |
| Overall | Male | £17.90 | £0.04 | 0.24% |
| Female | £17.86 |
Medical and Dental
The information below highlights the mean gender pay gap and median gender pay gap for those staff employed on Medical and Dental terms and conditions. The figures include the Clinical Excellence Awards payments that are paid to eligible medical staff.
- Mean Gender Pay Gap: 0.28% more than males –– equating to £0.14 per hour more
- Median Gender Pay Gap: 18.43% more than males –– equating to £8.57 per hour more
2025
| Mean | Gender | Mean Hourly Pay | Difference | Gap |
| Overall | Male | £49.09 | -£0.14 | -0.28% |
| Female | £49.23 | |||
| Median | Gender | Median Hourly Pay | Difference | Gap |
| Overall | Male | £46.50 | -£8.57 | -18.43% |
| Female | £55.07 |
Compared with last year, there has been a reduction in the gender pay gap within the medical workforce from both a mean and median calculation.
The mean gender pay gap within the medical workforce has decreased from 3.70% in 2024 to -0.28% in 2025 showing that females earn slightly more on average than males.
The median gender pay gap has also decreased between male and females in the past year from 0.01% to -18.43%. Due to the significant difference from 2024, a manual visually check was carried out against the raw data for accuracy.
Bonus Payments
Under the regulations, payments that would fall under the remit of bonus would include Clinical Excellence Awards for consultants and Long Service Awards.
- Clinical Excellence Awards (CEA)
The contractual entitlement to access an annual award round ceased on 1 April 2024. The 2023/24 award round was the final Local Clinical Excellence Award round.
Pre-2018 LCEAs will be retained, remaining pensionable and consolidated, but their value is frozen. These changes will have an impact on future pay gap reports.
Based on current guidance, the table below shows the mean and median bonus pay linked to clinical excellence awards only.
2025
| Gender | Mean Bonus Pay | Median Bonus Pay |
| Male | £9,715.99 | £9,048.00 |
| Female | £4,902.78 | £3,015.96 |
| Difference | £4,813.21 | £6032.04 |
| Pay Gap % | 49.54% | 66.67% |
There were 46 eligible consultants who received a Clinical Excellence Award in 2025, 17 were females and were 29 males. This is a decrease from 2024 where 114 consultants received the Clinical Excellence Awards.
There continues to be more males receiving larger monetary amounts due to the historical awards which is evident by the mean bonus gender gap percentage.
It is important to note that compared to the Trust gender split, within this staff group there is more of an even split of males and females.
Comparing this year’s data with 2024, the pay gap for mean bonus has increased from 43.85% to 49.54%. The median bonus in 2024 was 53.08% and in 2025 it has increased to 66.67%. The change observed in 2025 reflects a higher proportion of male consultants receiving larger bonus awards.
Long Service Awards
The Trust operates a locally agreed long service award scheme to recognise the service of staff who have 25 years NHS service. The award is a £100 gift voucher. In the reporting period a total of 132 staff received an award. Of those awarded in 2025, 104 were female (79%) and 28 were male (21%).
Under the Regulation we are required to include payments which relate to profit sharing, productivity, performance, incentive or commission should be included in the bonus calculations. It could be argued long service awards do not provide the incentive usually associated with the criteria outlined above. Guidance from ACAS states that such payments with a monetary value should be included in the bonus calculations.
Total Bonus Payments
The table below provides combined details of the clinical excellence awards and long service awards.
- The mean bonus pay has increased from 64.59% in 2024 to 84.31% in 2025 which means that the mean for men is 84.31% higher than the mean for women.
- The median bonus pay has slightly decreased from 96.25% in 2024 to 95.03% in 2025.
2025
| Gender | Mean Bonus Pay | Median Bonus Pay |
| Male | £4,938.47 | £2,010.70 |
| Female | £774.77 | £100 |
| Difference | £4,163.70 | £1,910.70 |
| Pay Gap % | 84.31% | 95.03% |
It is important to recognise when combining the bonus awards in this way the data is skewed as long service awards are predominantly paid to women, with a higher proportion of males receiving clinical excellence award payments. These payments are also not prorated.
Overall percentage of males and females receiving bonus payments
- Female: 1.9%
- Male: 3.1%
The guidance requires us to calculate the percentage of males and females who have received a bonus as a percentage of all employed males and females (not just those on full pay which other aspects of the gender reporting require us to do).
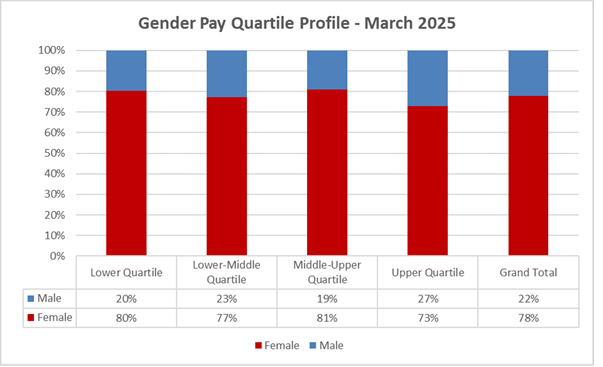
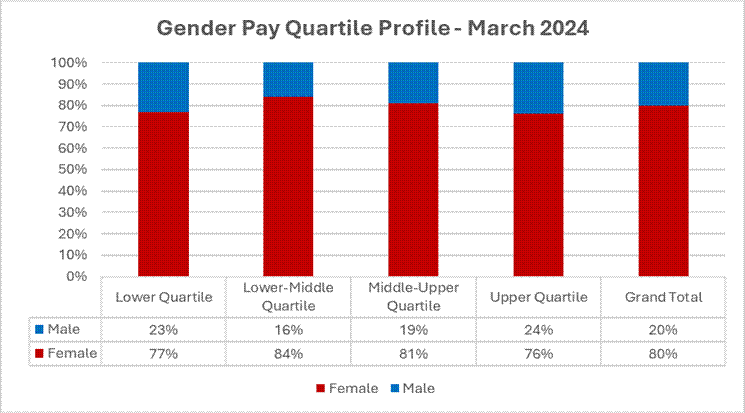
Gender Pay Quartile Profile
The following graph shows the proportion of males and females in each pay quartile. The lower quartile represents the lowest salaries in the Trust and the upper quartile represents the highest salaries. The Trust employs more women than men in every quartile.
The lower-middle quartile in 2025 has shown a decrease in the proportion of females within that quartile from 84% in 2024 to 77% in 2025, and males increasing from 16% in 2024 to 23% in 2025.
The upper quartile showed a decrease in the proportion of females, from 76% in 2024 to 73% in 2025, while the proportion of males increased from 24% to 27%.
2025
2024
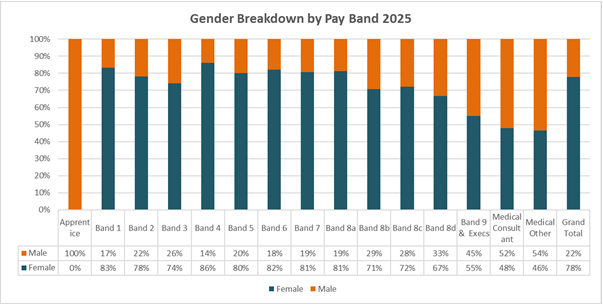
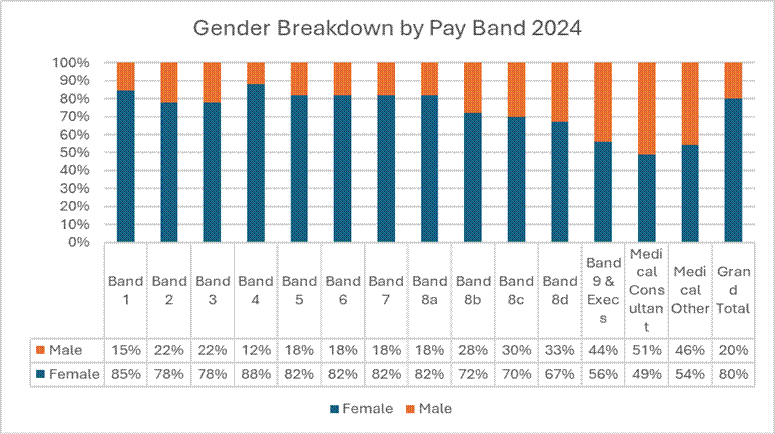
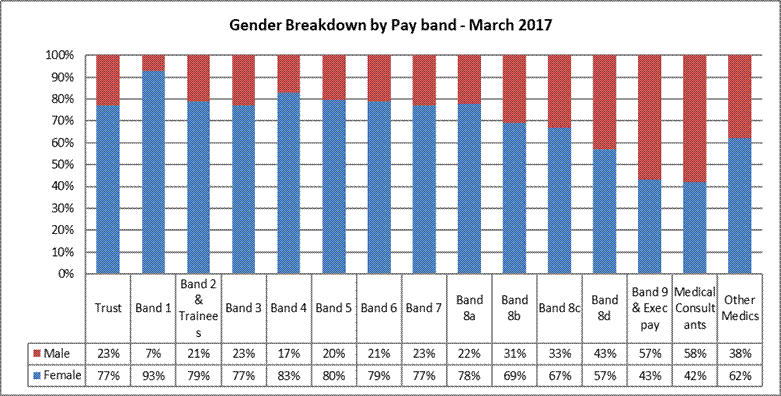
Gender Breakdown by Pay Band
The three graphs below provide a comparison of the Trusts gender profile breakdown by pay band at March 2025, 2024, and March 2017 when reporting commenced.
The ratio between males and females comparing 2025 to 2024 have shown little change withing Band 9 and VSM roles. In 2024 females accounted for 56% of this group whereas in 2025 they account for 55%. Males in this banding have increased from 44% in 2024 to 45% in 2025.
Comparing data between 2017 and 2025 shows that the proportion of females in bands 8d, 9, VSM, and consultant posts have had the largest increases from 57% in 2017 to 67% in both 2024 and 2025.
Comparing data from 2017 with 2025 shows that the proportion of females 8d, 9 and VSM pay and in consultant posts have had the largest increases.
Females in 8d posts have increased from 57% to 67% between 2017 and 2025. Band 9 and VSM pay grades have seen an increase in females from 43% to 69% in 2022, this has then decreased in 2025 to 55%.
The female consultant workforce has increased from 42% in 2017, to 49% 2024 and decreased to 48% in 2025.
Females in other medical grades have seen a slight fluctuation, starting at 62% in 2017, to 54% in 2024 and has reduced to 46% in 2025.
Band 1 was closed to new entrants from 1 December 2018, therefore the number of overall staff in this banding will continue to reduce as people leave the role.
2025
2024
2017
Key Findings:
- The mean and the median pay gap have increased from 2024.
- The overall median gender pay gap has increased since last year from 0.00% to 2.03%.
- Females in other medical grades have seen a slight fluctuation, starting at 62% in 2017, to 54% in 2024 and has reduced to 46% in 2025.
- The lower-middle quartile in 2025 has shown a decrease in the proportion of females within that quartile from 84% in 2024 to 77% in 2025, and males increasing from 16% in 2024 to 23% in 2025.
- There were 46 eligible consultants who received a Clinical Excellence Award in 2025, 17 were females and were 29 males. This is a significant decrease from 2024 where 114 consultants received the Clinical Excellence Awards. This is due to the changes in relation to the contractual entitlement to access an award round which ceased in 2024.
- The mean bonus pay has increased from 64.59% in 2024 to 84.31% in 2025.
Proposed Areas for Further Action Specific to the Gender Pay Gap Report:
- To continue to review how changes to the Clinical Excellence Awards impact on the gender pay gap.
Appendix 2
Tees, Esk and Wear Valleys NHS Foundation Trust Ethnicity Pay Gap Report – 2025
In June 2023 the Equality, Diversity and Inclusion Plan set out six targeted actions to address direct and indirect prejudice and discrimination, that exists through behaviour, policies, practices and cultures against certain groups and individuals across the NHS workforce.
High Impact action three requires us to develop and implement an improvement plan to eliminate pay gaps.
We are required to analyse data to understand pay gaps by protected characteristic and put in place an improvement plan. This will be tracked and monitored by NHS boards.
A pay gap is the difference between the average hourly pay of employees in one group in comparison to another group. For example, women in comparison to men or LGBTQ+ in comparison to heterosexual.
This is different to equal pay. Equal pay is a person being paid the same for the same role and it is unlawful to pay someone differently for doing the same job based on a protected characteristic.
The Trust is committed to understanding any differences identified in the ethnicity pay report and will undertake further analysis to gain a better understanding as to the reason for the differences and to take action where appropriate.
Pay gaps can negatively affect the retention of the NHS workforce. They can make it harder to recruit and can have a detrimental impact on staff experience when in post.
This is our third ethnicity pay gap report. We have analysed information using the categories: White, Not Stated (which includes not known) and BAME. BAME is all other ethnic minority groups combined.
At this stage we have not broken down BAME any further due to the small numbers in each category and recommendations are that there should be at least 50 staff in each group to ensure statistical robustness.
Guidance on ethnicity pay gaps has been produced in May 2023 with recommendations as to what metrics organisations can consider using to measure their ethnicity pay gap. We have applied the calculations and analysis methods used in Gender Pay Gap reporting.
It is recommended that we review the mean and median ethnicity pay gaps, mean and median bonus gaps and proportions of ethnicities in each quartile of pay bands.
Under the regulations, payments that would fall under the remit of a bonus includes Clinical Excellence Awards for consultants and Long Service Awards.
Finally, it is important to note that analysis of pay gaps are multi-dimensional and complex. Undertaking pay gap reports helps us to identify where pay differences exist and identify actions to understand those disparities better. Reporting annually is an important step to allow us to see how our pay disparities are changing.
The ethnicity profile of the Trust 2025
| Ethnicity | Percentage |
| BAME | 9.6% |
| Not Stated | 1.1% |
| White | 89.2% |
Please note these figures exclude bank workers. The remainder of the report includes data pertaining to substantive staff plus any bank workers who worked on 31 March 2025.
Mean and Median Ethnicity Pay Gap
The mean ethnicity pay gap and median ethnicity pay gap for all employees is detailed below. Gross pay calculations are used for these purposes. This includes enhancements, clinical excellence awards and long service awards. Overtime payments are excluded from these calculations.
In line with guidance, only staff on full pay are included in the calculations therefore staff on reduced pay for sickness, maternity or other reasons are excluded. Staff who did not state their ethnicity or are classified as unknown are not included within these figures.
2025
| Mean | Ethnicity | Average Hourly Pay | Difference | Gap |
| Overall | White | £20.16 | -£1.46 | -7.23% |
| BAME | £21.62 | |||
| Non-medical & exec | White | £19.50 | £2.26 | 11.60% |
| BAME | £17.24 | |||
| Medical only | White | £54.53 | £9.44 | 17.31% |
| BAME | £45.09 |
The overall figures show that BAME staff are paid higher than White staff by £1.46.
By breaking down the pay gap to non-medical and staff on Very Senior Manager (VSM) pay and medical separately it can be seen that there is an ethnicity pay gap evident.
The reason for this difference is that overall, we have a low number of BAME staff employed compared to white staff. This impacts on the average hourly pay of that group of staff, compared with the average hourly rates of the much larger white workforce in each grade.
Also, our BAME workforce has a significantly higher proportion of medics within it which results in a higher average hourly rate.
The overall median ethnicity pay gap table below also appears to demonstrate that there is an ethnicity pay gap between white and BAME staff and that white staff are paid higher than BAME staff by £1.43.
A breakdown by non-medical and VSM pay and medical also shows that a pay gap exists, although the overall gap has decreased from £3.17 in 2024 to £1.43 in 2025.
The pay gap amongst medical only staff has increased from 23.98% (£12.50) in 2024 to 28.92% (£16.41) in 2025.
2025
| Median | Ethnicity | Median Hourly Pay | Difference | Gap |
| Overall | White | £18.66 | £1.43 | 7.69% |
| BAME | £17.22 | |||
| Non-medical & exec | White | £18.49 | £2.21 | 11.95% |
| BAME | £16.28 | |||
| Medical only | White | £56.74 | £16.41 | 28.92% |
| BAME | £40.33 |
In addition to the proportion of BAME staff employed by the Trust, there are other possible contributory factors which can influence the pay gap differences. The Trust operates a number of salary sacrifice schemes which affords staff the opportunity to purchase vouchers towards childcare costs, purchase a cycle, electrical goods or a lease car.
The costs associated with salary sacrifice schemes are deducted prior to calculating gross pay. This will have an impact on the gross pay calculations undertaken to determine the mean and median ethnicity pay gap and will be one of a number of contributory factors which may be causing the differences being reported.
2025
| Row Labels | Count of Employee Number | % |
| BAME | 107 | 6.3% |
| White | 1593 | 93.2% |
| Not stated | 10 | 0.6% |
| Grand Total | 1710 | 100% |
The numbers of BAME staff who have salary sacrifice deductions is very low, with 107 staff accessing this benefit compared with 1593 white staff. BAME staff accessing the scheme equates to 6.3% of all salary sacrifices within the Trust which shows BAME staff are less likely to access salary sacrifices.
A breakdown by type of salary sacrifice for BAME staff has not been provided due to staff being potentially identifiable due to the low numbers involved.
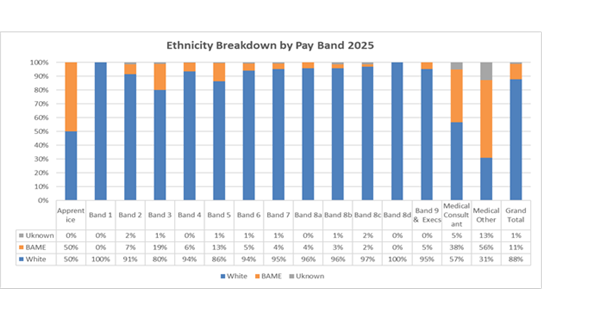
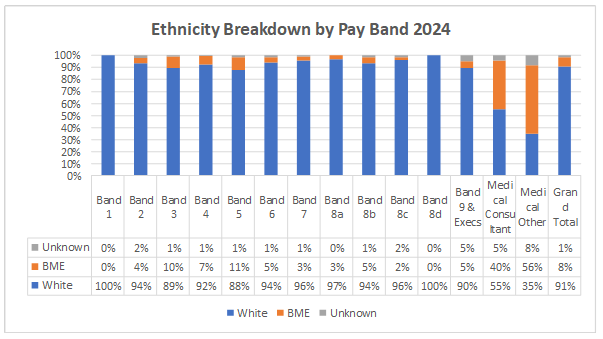
Ethnicity Breakdown by Pay Band
The following graph provides a breakdown of ethnicity by pay band. It is evident that the highest number of our BAME workforce are within the medical workforce.
Band 1 was closed to new entrants from 1 December 2018, therefore the number of overall staff in this banding will continue to reduce.
2025
2024
Ethnicity Pay Quartile Profile
The following graph shows the proportion of staff by ethnicity in each pay quartile. The lower quartile represents the lowest salaries in the Trust and the upper quartile represents the highest salaries.
The Trust employs more white staff than BAME staff in every quartile. The highest percentage of BAME staff are within the lower quartile and lower-middle quartile
2025
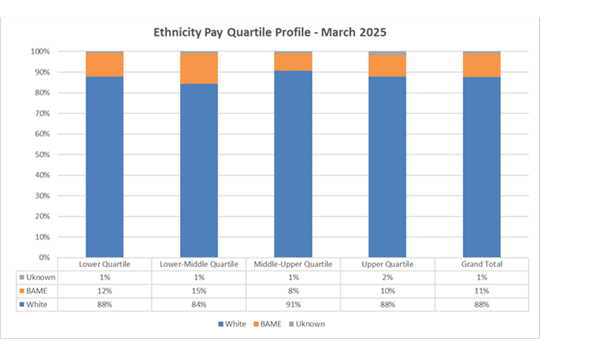
2024
Bonus Payments
Under the regulations, payments that would fall under the remit of bonus would include Clinical Excellence Awards for consultants and Long Service Awards.
- Clinical Excellence Awards (CEA)
The contractual entitlement to access an annual award round ceased on 1 April 2024. The 2023/24 award round was the final Local Clinical Excellence Award round.
Pre-2018 LCEAs will be retained, remaining pensionable and consolidated, but their value is frozen. These changes will have an impact on future pay gap reports.
Based on current guidance, the table below shows the mean and median bonus pay linked to clinical excellence awards only.
2025
| Ethnicity | Mean Bonus Pay | Median Bonus Pay |
| White | £7,563 | £3,015 |
| BAME | £7,333 | £6,032 |
| Difference | £230 | -£3,017 |
| Pay Gap % | 1.38% | -100% |
46 eligible consultants received a Clinical Excellence Award in the reporting year of 2025. 24 consultants were white (52.2%), 19 consultants were from BAME backgrounds (41.3%), and 3 consultants had not stated / unknown ethnic origins (6.5%).
The data suggests that white consultants are paid more CEA amounts compared with BAME consultants. However, due to the small number of staff receiving these payments, one or 2 staff with high or low CEA levels can have a significant impact on the overall averages.
Long Service Awards
The Trust operates a locally agreed long service award scheme to recognise the service of staff who have 25 years NHS service. The award is a £100 gift voucher. In the reporting period a total of 132 staff received an award. Of which 118 were White (89.39%), 8 were from a BAME background (6.06%) and 6 had not stated their ethnicity (4.55%).
The percentage of BAME staff receiving a long service award has increased from 2.5% in 2024 to 6.06 % in 2025.
Under the Regulation we are required to include payments which relate to profit sharing, productivity, performance, incentive or commission should be included in the bonus calculations. It could be argued long service awards do not provide the incentive usually associated with the criteria outlined above.
Guidance from ACAS states that such payments with a monetary value should be included in the bonus calculations.
Total Bonus Payments
The table below provides combined details of the clinical excellence awards and long service awards.
It should be noted that the numbers of BAME staff involved in these calculations is very low and overall, as a proportion of the workforce, the numbers of staff receiving bonus’s as per these guidelines is very small. These payments are also not pro-rated.
When combining CEA and long service awards, this data suggests that BAME staff receive higher pay than white staff in relation to bonus.
2025
| Ethnicity | Mean Bonus Pay | Median Bonus Pay |
| White | £1,361.44 | £100.00 |
| BAME | £5,189.90 | £3,015.97 |
| Difference | -£3,828.46 | -£2,915.97 |
| Pay Gap % | -281.21% | -2915.97% |
Overall percentage of receiving bonus payments
The guidance requires us to calculate the percentage of white and BAME staff who have received a bonus as a percentage of all employed white and BAME staff (not just those on full pay which other aspects of the reporting require us to do).
- 1.95% of BAME staff received a bonus in 2025 compared to 8.3% in 2024
- 2.89% of white staff received a bonus in 2025 compared to 2.4% in 2024
The difference in percentages will be linked to the proportion of the BAME workforce which are medical and are therefore eligible for clinical excellence awards.
Key Findings:
- 1.95% of BAME staff received a bonus in 2025 compared to 8.3% in 2024.
- The percentage of BAME staff receiving a long service award has increased from 2.5% in 2024 to 6.06 % in 2025.
- The number of BAME staff within the organisation is low and a high percentage of the BAME workforce in the Trust are medical. Therefore, when calculating average pay for BAME staff, data could be skewed by smaller numbers of higher paid staff.
- Whilst overall data shows that BAME staff average hourly pay is higher than White staff, when separating non-medical & executive pay and medical pay grades, the data shows that there is a pay gap evident in both groups.
- Similar to last year our BAME consultants are receiving higher bonus payments.
- Very low levels of BAME staff are within higher bands, (excluding medical grades).
Proposed Areas for Further Action Specific to the Ethnicity Pay Gap Report:
- Continue explore the reasons for low numbers of BAME staff being eligible for long service awards and if this is linked with retention of our BAME workforce in the NHS and associated reasons.
- Continue to explore if there are any reasons for the lower numbers of BAME staff in certain pay grades within the Trust.
Appendix 3
Tees, Esk and Wear Valleys NHS Foundation Trust Disability Pay Gap Report – 2025
In June 2023 the Equality, Diversity and Inclusion Plan set out six targeted actions to address direct and indirect prejudice and discrimination, that exists through behaviour, policies, practices and cultures against certain groups and individuals across the NHS workforce.
High Impact action three requires us to develop and implement an improvement plan to eliminate pay gaps.
We are required to analyse data to understand pay gaps by protected characteristic and put in place an improvement plan. This will be tracked and monitored by NHS boards.
A pay gap is the difference between the average hourly pay of employees in one group in comparison to another group. For example, women in comparison to men or LGBTQ+ in comparison to heterosexual.
This is different to equal pay. Equal pay is a person being paid the same for the same role and it is unlawful to pay someone differently for doing the same job based on a protected characteristic.
The Trust is committed to understanding any differences identified in the disability pay report and will undertake further analysis to gain a better understanding as to the reason for the differences and to take action where appropriate.
This is the second disability pay gap report from the first report in 2024. We have analysed information using the categories: Declared a Disability, Not Declared (which includes not known) and Declared no Disability.
In the absence of specific guidance under this new reporting requirement, we have applied the calculations and analysis methods used in Gender Pay Gap reporting.
The disability profile of the Trust 2025
| Disability | Percentage |
| Declared a Disability | 11.8% |
| Not Stated | 11% |
| Declared no Disability | 77.2% |
Please note these figures exclude bank workers. The remainder of the report includes data pertaining to substantive staff plus any bank workers who worked on 31 March 2025. This is in accordance with the Gender Pay Gap reporting requirements.
In line with gender pay gap reporting we are required to report annually on the following:
- Mean gender pay gap
- Median gender pay gap
- Mean bonus gender gap *
- Median bonus gender gap *
- The proportion of males receiving a bonus payment *
- The proportion of females receiving a bonus payment *
- Proportions of males and females in each quartile of pay band
*Under the regulation payments that would fall under the remit of bonus would include Clinical Excellence Awards for consultants and Long Service Awards.
Mean and Median Disability Pay Gap
The mean disability pay gap and median disability pay gap for all employees is detailed below. Gross pay calculations are used for these purposes.
In line with guidance, only staff on full pay are included in the calculations therefore staff on reduced pay for sickness, maternity or other reasons are excluded. Overtime payments are also excluded from these calculations.
2025
| Mean | Disability | Mean Hourly Pay | Difference | Gap |
| Overall | Declared no Disability | £20.40 | £0.82 | 4.03% |
| Declared a Disability | £19.58 | |||
| Non-medical & exec | Declared no Disability | £19.69 | £0.10 | 0.51% |
| Declared a Disability | £19.59 | |||
| Medical only | Declared no Disability | £50.29 | £1.97 | 3.92% |
| Declared a Disability | £48.32 |
The mean disability pay gap shows that staff who declared they had a disability are paid £0.82 per hour less than staff that declared no disability.
2025
| Median | Disability | Median Hourly Pay | Difference | Gap |
| Overall | Declared no disability | £20.85 | £0.58 | 2.77% |
| Declared a disability | £20.27 | |||
| Non-medical & exec | Declared no disability | £18.66 | -£0.15 | -0.80% |
| Declared a disability | £18.81 | |||
| Medical only | Declared no disability | £55.09 | £9.35 | 16.97% |
| Declared a disability | £45.74 |
The median disability pay gap shows that there is a pay gap of 2.77% identified and staff who declare no disability are paid £0.58 more per hour than staff who declare a disability.
There are a number of possible contributory factors which can influence the disability pay gap differences. The Trust operates a number of salary sacrifice schemes which affords staff the opportunity to purchase vouchers towards childcare costs, purchase a cycle, electrical goods or a lease car.
The costs associated with salary sacrifice schemes are deducted prior to calculating gross pay. This will have an impact on the gross pay calculations undertaken to determine the mean and median disability pay gap and will be one of a number of contributory factors which may be causing the differences being reported.
It is important to note that some staff have more than one salary sacrifice in place (some have up to five) and that amounts of deductions can vary considerably. The table below details the percentage of staff with salary sacrifices and their disability status.
2025
| Row Labels | Percentage of Employees |
| Declared a Disability | 12.22% |
| Declared no Disability | 75.96% |
| Not stated | 11.81% |
| Grand Total | 100% |
The schemes which are most popular are electronics and lease cars, the latter of which has the largest cost associated.
Bonus Payments
Under the regulations, payments that would fall under the remit of bonus would include Clinical Excellence Awards for consultants and Long Service Awards.
- Clinical Excellence Awards (CEA)
The contractual entitlement to access an annual award round ceased on 1 April 2024. The 2023/24 award round was the final Local Clinical Excellence Award round.
Pre-2018 LCEAs will be retained, remaining pensionable and consolidated, but their value is frozen. These changes will have an impact on future pay gap reports.
Based on current guidance, the table below shows the mean and median bonus pay linked to clinical excellence awards only.
2025
| Disability | Mean Bonus Pay | Median Bonus Pay |
| Declared a Disability | £7,539.96 | £7,539.96 |
| Declared no Disability | £7,108.43 | £3,015.97 |
| Difference | -£431.53 | -£4,523.99 |
| Pay Gap % | -6.07% | -150.00% |
All 46 eligible consultants received a Clinical Excellence Award in the reporting year. 65.2% of consultants had declared that they did not have a disability, 4.4% of consultants had declared that they had a disability, and 30.4% consultants had not stated / unknown disability status.
The data suggests that consultants who have declared a disability are paid less CEA amounts compared with those consultants who have not declared a disability. However, due to the small number of staff declaring that they have a disability and the relatively high percentage of consultants not declaring their disability status, this conclusion should be read with caution.
Long Service Awards
The Trust operates a locally agreed long service award scheme to recognise the service of staff who have 25 years NHS service. The award is a £100 gift voucher. In the reporting period a total of 132 staff received an award. Of which 84 had declared that they did not have a disability (63.6%), 16 staff had declared that they had a disability (12.1%) and 32 had not stated their disability status (24.2%).
Under the Regulation we are required to include payments which relate to profit sharing, productivity, performance, incentive or commission should be included in the bonus calculations. It could be argued long service awards do not provide the incentive usually associated with the criteria outlined above. Guidance from ACAS states that such payments with a monetary value should be included in the bonus calculations.
Total Bonus Payments
The table below provides combined details of the clinical excellence awards and long service awards. It should be noted that the numbers of staff involved in these calculations and declaring that they have a disability is very low. Overall, as a proportion of the workforce, the numbers of staff receiving bonus’s as per these guidelines is very small. These payments are also not pro-rated.
2025
| Disability | Mean Bonus Pay | Median Bonus Pay |
| Declared a Disability | £926.66 | £100.00 |
| Declared no Disability | £1,944.32 | £100.00 |
| Difference | £1,017.66 | £0.00 |
| Pay Gap % | 52.34% | 0.00% |
Overall percentage of receiving bonus payments
The guidance requires us to calculate the percentage of staff, by their disability status, as a percentage of all employed staff (not just those on full pay which other aspects of the reporting require us to do).
0.22% of staff who have declared themselves as having a disability received a bonus in 2025. This has decreased when comparing figures to 2024 where 0.32% of staff received a bonus.
1.37% of staff who declared that they did not have a disability received a bonus in 2025. This has decreased when comparing figures to 2024 where 2.24% of staff received a bonus.
It is likely that the number of staff who have not declared their disability status and received bonus payments this year impacts on the above percentage rates.
It is important to recognise when combining the bonus awards in this way the data is skewed as more staff receive long service awards than clinical excellence awards and long service awards are significantly lower monetary amounts. These payments are also not prorated.
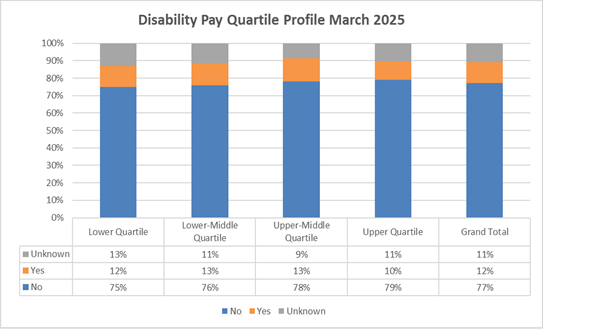
Disability Pay Quartile Profile
The following graph shows the proportion of disabled staff and non disabled staff in each pay quartile. The lower quartile represents the lowest salaries in the Trust and the upper quartile represents the highest salaries. The Trust employs more staff that declare no disability than staff who declare a disability in every quartile.
The ‘unknown’ category shows a reported decrease across the majority of quartiles when compared to 2024 data. This could be due to Trustwide efforts to collect this data. This will increase the accuracy of the disability pay gap due to more data being available in ESR.
2025
2024
Disability Breakdown by Pay Band
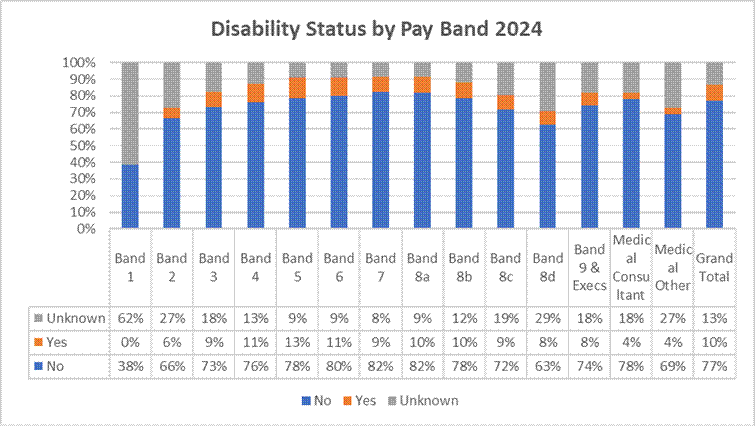
The graph below provides the Trusts disability profile breakdown by pay band as of March 2025 when reporting commenced.
2025
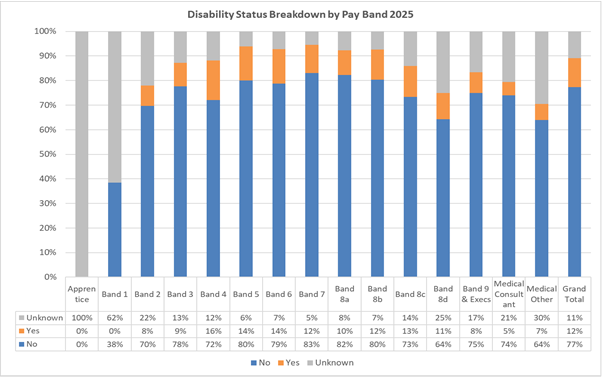
2024
Key Findings:
- This is the second disability pay gap report that the Trust has produced following the first report that was completed in 2024. Comparisons have therefore been able to take place this year.
- The number of staff who have declared themselves as having a disability is likely to be under reported, therefore the data analysis is likely to be impacted by this.
- 30.4% of consultants had not declared their disability status which is an increase from 2024 (23%). This will have an impact on the bonus section of this report.
- The mean shows that staff declaring they don’t have a disability are paid £0.82 more than staff who declare having a disability and £0.58 more when looking at the median.
- The ‘unknown’ category shows a reported decrease across the majority of quartiles when compared to 2024 data. This could be due to Trustwide efforts to collect this data. This will increase the accuracy of the disability pay gap due to more data being available in ESR.
- 0.22% of staff who have declared themselves as having a disability received a bonus in 2025. This has decreased when comparing figures to 2024 where 0.32% of staff received a bonus.
Proposed Areas for Further Action Specific to the Disability Pay Gap Report:
- Continue to encourage staff, particularly medical staff, to declare on ESR their disability status.
Current Trust actions that impact on all Pay Gaps:
- Continue to promote the use of the virtual interview platform (SAMMI), which aims to reduce bias in the recruitment process.
- Promote the new managers training which will include unconscious bias.
- Continue to promote the central reasonable adjustments team to enable staff with underlying health conditions to fulfil their potential.
- Promote the Steps Towards Employment Programme (STEP) to people from communities who don’t usually work for the NHS and carry out community engagement events across these communities.
- Carry out a Trust wide communication campaign around the importance of data completeness on ESR.